.svg)
.svg)
Key Takeaways
- A major pipeline operator managing more than 3,200 miles of right-of-way cut ground patrol sites from 400 to 40, achieving a 90 percent reduction in just three years.
- The same program delivered 100 percent sustained right-of-way compliance without increasing the operator’s total clearing budget.
- Forsite replaced reactive clearing with a data-driven work planning framework built on LiDAR, aerial imagery, risk scoring, and multi-year scheduling.
- More than 6,400 sites were monitored and prioritized using vegetation density, slope safety, ground patrol cost, growth rate, clearing suitability, and proximity to the pipeline.
- Annual maintenance cost savings of 35 percent or more were sustained compared with reactive vegetation management.
- Quarterly GIS updates, patrol-integrated imagery, and AI-powered change detection helped validate completed work and reduce reliance on expensive ground inspections.
- The program shows how proactive vegetation work planning can turn a growing compliance and cost problem into a stable, long-term operational advantage.
When Reactive Clearing Stops Working, the Costs Compound Fast
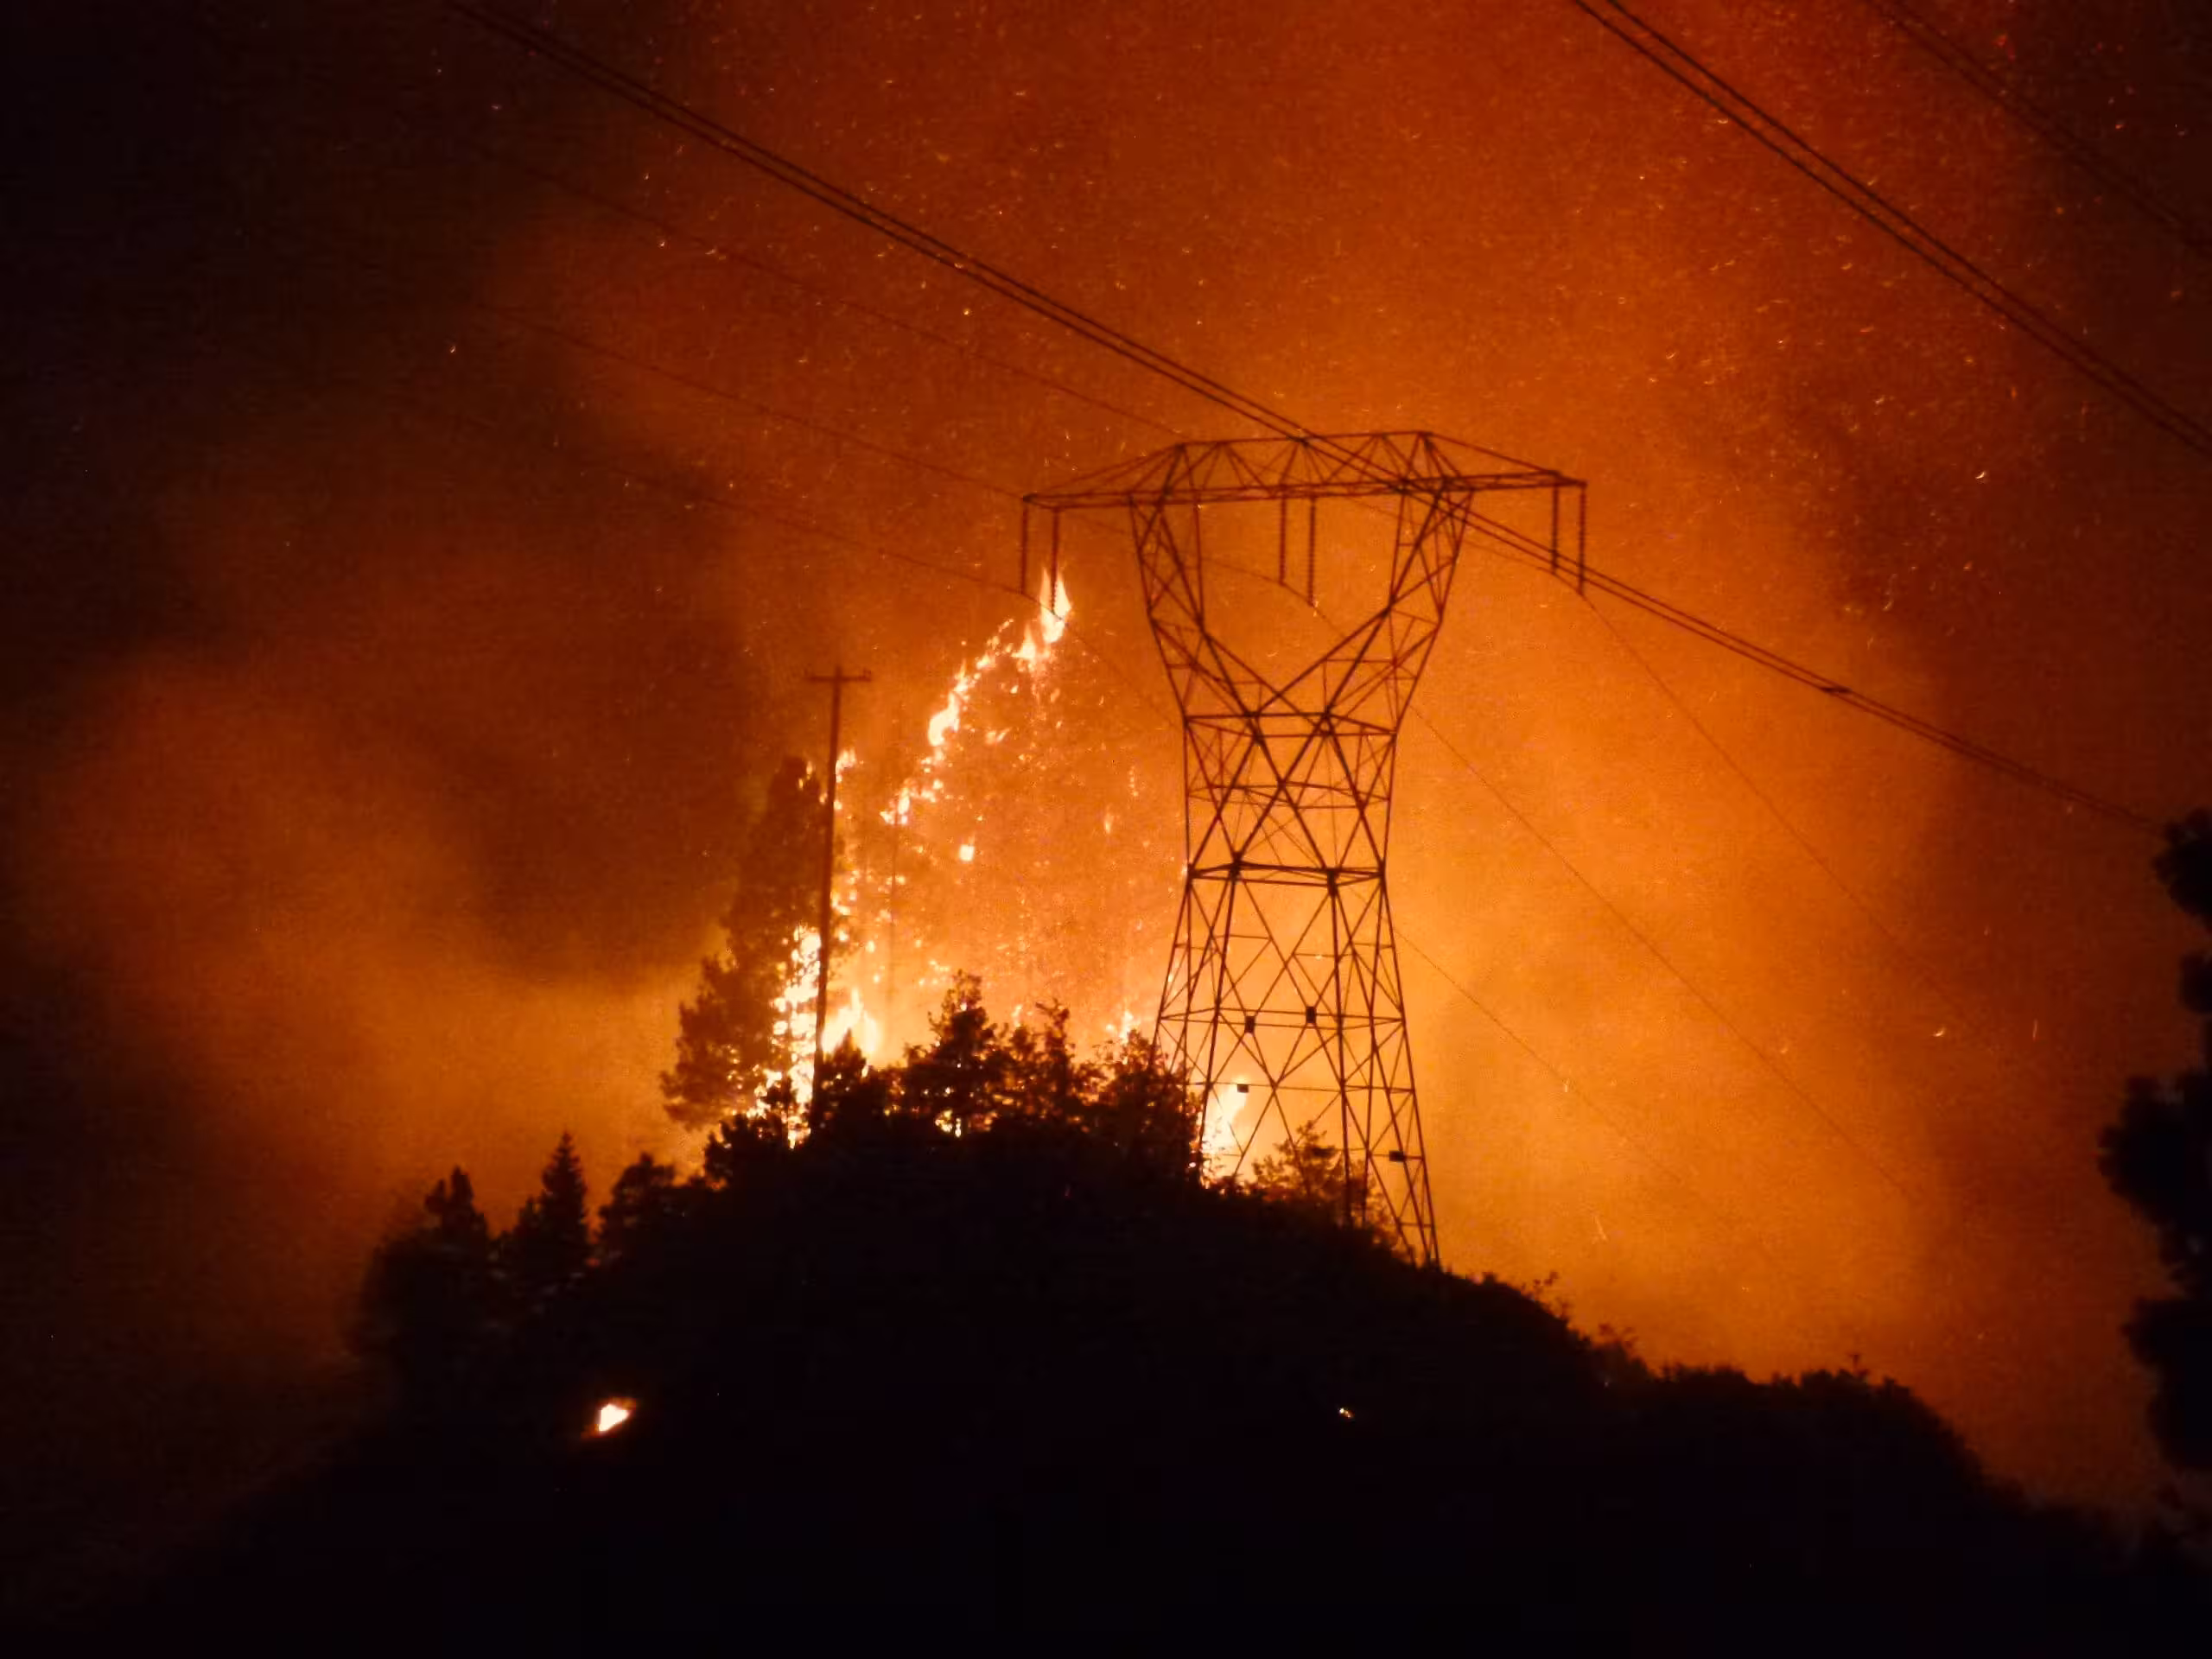
For a major pipeline operator managing more than 3,200 miles of right-of-way, vegetation management had become a slow-moving crisis. Years of inconsistent clearing spend had allowed unchecked growth to accumulate across the network. By 2020, approximately 20 percent of the system was at or near non-compliance, and the number was climbing.
The visible symptom was cost. More than 400 individual right-of-way sites had been designated as red zones, each requiring expensive bi-weekly ground patrols because vegetation density had made aerial inspection inadequate. That number was growing rapidly year over year, with no structural plan in place to reverse it.
The underlying problem, however, was not the vegetation itself. It was the absence of data.
Without a system-wide view of right-of-way conditions — which sites were critical, which were approaching risk, and which could safely wait — every clearing decision was reactive. Crews were dispatched to the worst visible sites rather than the highest-priority ones. Budget was spent firefighting rather than preventing. And without a multi-year maintenance schedule, cleared sites grew back unchecked and cycled back into red zone status.
To break the cycle, the operator needed something it had never had before: a proven, data-driven work planning framework applied systematically across the entire network.
The Challenge: Three Compounding Gaps
Forsite’s initial assessment identified three structural gaps driving escalating costs.
The operator recognized that closing these gaps would require upfront investment. Forsite’s guidance, consistent with industry benchmarks, was to allocate 10 to 15 percent of the annual clearing budget to work planning. For an operator of this scale, that investment would pay back many times over.
The Solution: Forsite’s Turnkey Work Planning Framework
Forsite delivered the program in four structured phases, moving the operator from data deficiency to systematic control.
Phase 1: Data Acquisition and RoW Mapping
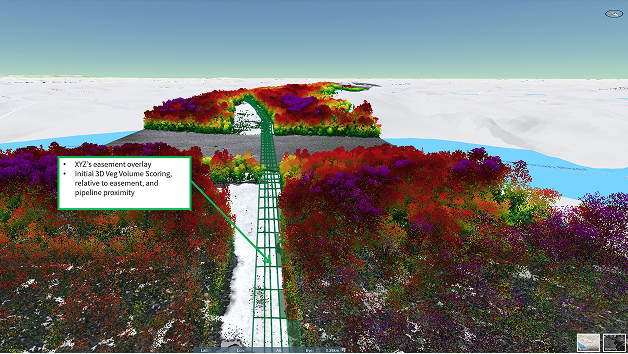
The first step was establishing a complete and accurate picture of the right-of-way. Forsite broke the entire 3,200-mile network into precise vegetation management site footprints — discrete, manageable units that could be individually scored, prioritized, and tracked over time.
Baseline data was captured using a combination of LiDAR collection during leaf-off acquisition windows, patrol-integrated aerial imagery, and existing data libraries. Using LiDAR and spectral inputs, Forsite determined the volume and structure of vegetation at each site, including individual tree inventories, canopy height, and proximity to the pipeline centerline. This established the ground truth the operator had never previously had.
Phase 2: Density and Risk Scoring
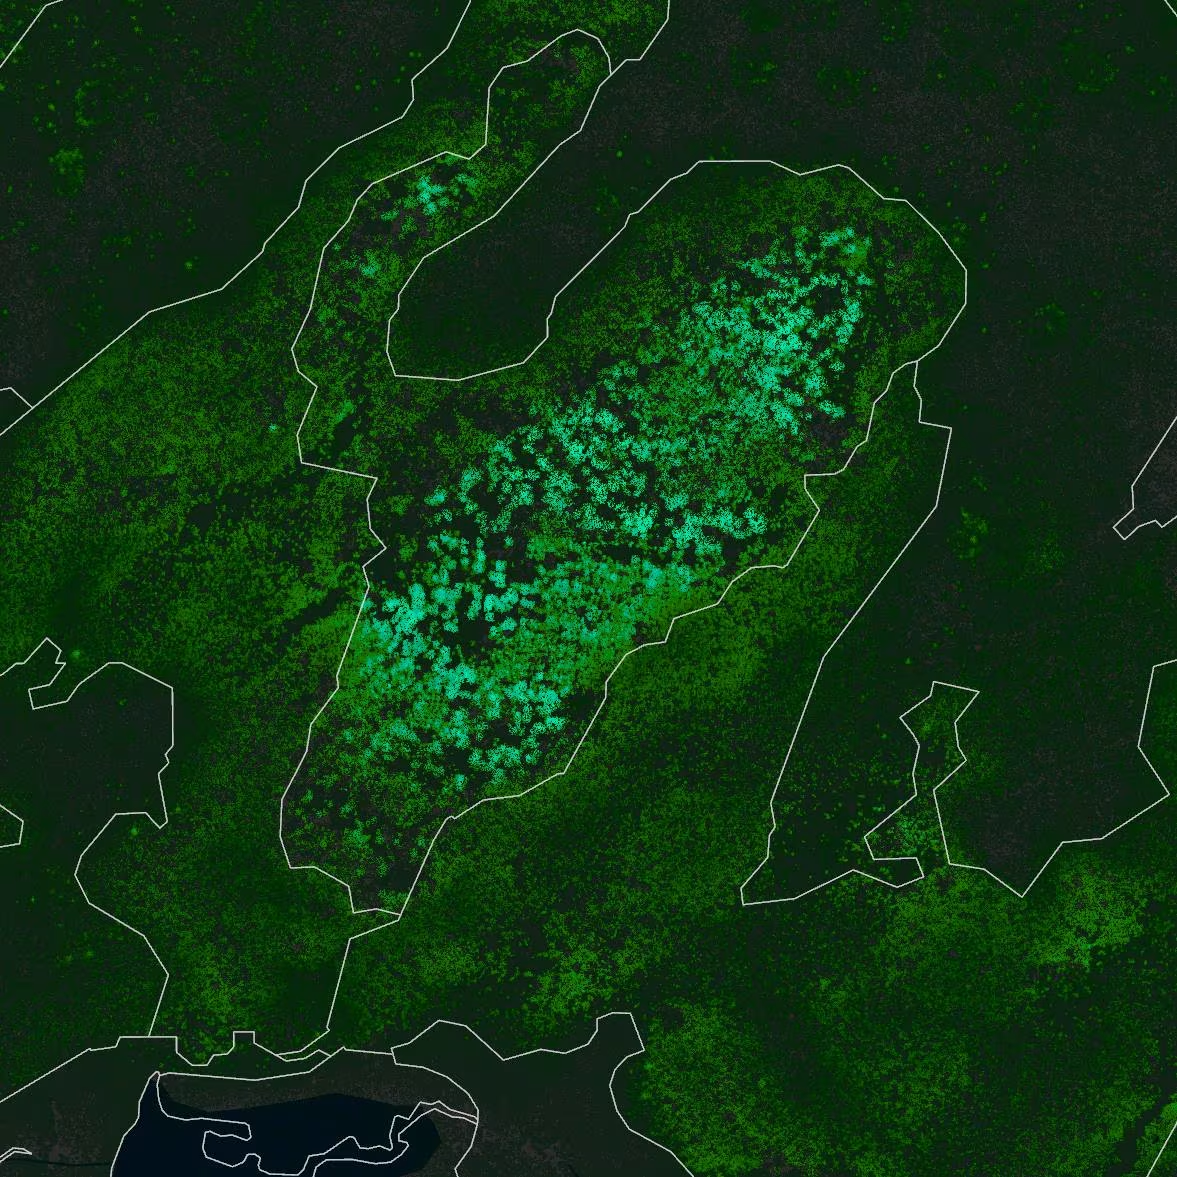
Every site across the network was scored on a 0–100 vegetation density index and assigned a heat score category.
Scoring incorporated multiple risk factors beyond vegetation density alone, including slope safety, ground patrol cost, projected growth rates, clearing method suitability, and pipeline proximity. This ensured that prioritization reflected true operational risk, not just visual appearance.
Phase 3: Multi-Year Work Plan Development
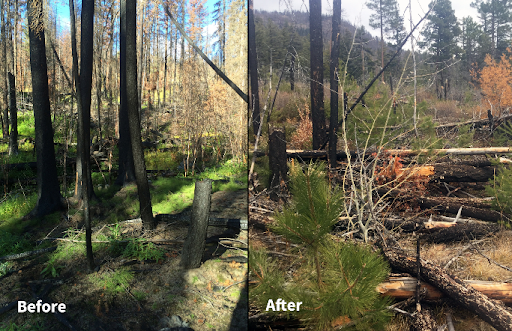
With every site scored and ranked, Forsite built a time-phased clearing schedule structured across immediate, Year 1, and multi-year horizons. The plan recommended clearing methods and maintenance cadences for each site based on vegetation type, density, growth rate, and terrain, ensuring that once cleared, sites would be maintained on a schedule that prevented them from cycling back into non-compliance.
Critically, the plan also incorporated site-level cost forecasting. The operator could see, for the first time, exactly where the annual clearing budget needed to go and what would happen if it did not.
Phase 4: Execution, Monitoring, and Continuous Control
Contractors were deployed against the prioritized work plan each year. Progress was tracked through GIS dashboards with zone classifications updated quarterly. As cleared sites were validated using aerial imagery captured from existing patrol flights, AI-powered change detection flagged vegetation regrowth automatically. Sites then transitioned from ground patrol back to standard aerial review, immediately reducing the bi-weekly ground patrol burden.
Over time, this created a self-reinforcing cycle: better data drove better decisions, better decisions drove more compliant sites, and more compliant sites reduced the cost of monitoring, freeing budget to stay ahead of the next wave of growth.
The Results: A 12-Year Transformation
The outcomes of the program, tracked across more than 6,400 monitored sites over twelve years, are among the most thoroughly documented in the pipeline vegetation management industry.
The first two years of the program showed an expected increase in non-compliant site counts — a natural consequence of the initial visibility exercise surfacing sites that had previously gone untracked. From Year 3 onward, as the structured work plan took effect, compliant green-zone sites expanded steadily year over year. By Years 10 through 12, the network had reached a stable, fully compliant state that required only routine maintenance to sustain.
The operator moved from a growing crisis with no structural solution to an industry-leading vegetation management program without increasing the total clearing budget. The difference was not spend. It was data.
Why This Model Works: The Economics of Proactive Planning
The financial logic of Forsite’s work planning framework is straightforward, but the compounding effect over time is significant.
Reactive clearing is inherently the most expensive form of vegetation management. By the time a site reaches red zone status, it typically requires intensive mechanical clearing on difficult terrain — the highest-cost intervention available. It also triggers ongoing ground patrol costs that can multiply what proactive maintenance would have cost years earlier.
Forsite’s analysis of a representative 3,000-mile system with a $10 million annual clearing budget showed that an optimized work plan, compared with a reactive baseline, generated increasing annual savings from Year 3 onward, reaching more than $14 million per year in savings by the middle years of the program. Over a 10-year horizon, the cumulative difference between reactive and optimized spend is substantial.
The upfront investment in data capture and work planning — typically 10 to 15 percent of annual clearing budget — is recovered within the first clearing cycle.
The Role of Imagery Capture in Closing the Loop
One of the less visible but operationally significant elements of this program was the use of Forsite’s aerial imagery capture service to validate contractor clearing work and manage the transition of sites back to aerial patrol.
Because the operator was already receiving continuous right-of-way imagery through Forsite’s patrol-integrated camera system, cleared sites could be visually verified within days of completion. This confirmed that vegetation had been removed to the required standard and that aerial inspection was once again viable. It also eliminated the need for dedicated post-clearing site visits and accelerated the reduction in ground patrol requirements.
The imagery capture record also created a defensible audit trail. Every site’s clearing history, current vegetation status, and patrol method was documented, time-stamped, and accessible through the GIS dashboard, supporting regulatory compliance reporting and internal governance.
Is Your RoW Vegetation Program Ahead of the Problem — or Behind It?
If your team is clearing reactively without a multi-year, data-driven work plan, the cost gap between where you are and where you could be is likely larger than you think. Contact Forsite to find out what a structured work planning program would look like for your network.
FAQ
How long does it take to develop a vegetation work plan for a large pipeline network?
Timeline depends on system size and the availability of existing LiDAR or imagery data. Where current data can be leveraged, Forsite can move from site footprint mapping through to a prioritized, time-phased work plan efficiently. For new data collection, leaf-off LiDAR acquisition windows are typically planned seasonally. Forsite opens onboarding windows quarterly.
Do we need to collect new LiDAR data, or can Forsite work with what we already have?
Forsite can work from existing LiDAR datasets, aerial imagery, or a combination of data sources. The highest accuracy is achieved with current LiDAR, but where recent data exists, the vegetation footprint can be updated using imagery, with accuracy scaling to the resolution of imagery available.
How does the vegetation heat score account for terrain and slope risk?
Slope safety is one of several weighted factors incorporated into site prioritization alongside vegetation density, ground patrol cost, clearing cost, and growth rate. High-slope sites receive tailored safety insights and are flagged for appropriate clearing method recommendations in the work plan.
How are clearing results validated once contractors complete work?
Operators using Forsite’s patrol-integrated imagery capture service can verify contractor clearing work within days of completion using the aerial imagery already being collected on routine patrols. This confirms visibility improvements, supports transition back to aerial inspection, and creates a documented compliance record without additional flight cost. The same patrol platform also supports methane leak detection using the FalconXL laser sensor and LiDAR-based geohazard monitoring, enabling operators to address multiple compliance programs from a single flight.
What does the ongoing monitoring program look like after the initial work plan is delivered?
Zone classifications are updated quarterly through GIS tracking as contractor work is executed and new imagery is processed. The work plan is treated as a living document, updated to reflect current right-of-way conditions, adjust maintenance cadences as growth rates are observed, and incorporate new budget cycles. Forsite describes this as an evergreen approach to right-of-way compliance.
What other pipeline intelligence services does Forsite offer alongside vegetation work planning?
Forsite’s PatrolView™ suite also includes aerial imagery capture and AI-powered threat detection integrated into existing patrol flights, aerial methane leak surveys using the FalconXL laser sensor, LiDAR-based geohazard monitoring for ground movement detection along pipeline corridors, GIS-based compliance and patrol reporting applications, and wildfire risk assessment for pipeline infrastructure.
.avif)
.png)