.svg)
Forest Inventory
Forest Inventory Services: LiDAR Digital Inventory, Ground Plot Programs, and Carbon Inventory Across North America
An inventory is only useful if you can defend it. Whether the output is going to a timber supply review, a development permit, a carbon program verifier, or a strategic investment decision, the data needs to be accurate, statistically sound, and transparently documented.
Forsite delivers inventory programs across the full spectrum: Individual Tree Inventory (ITI) using LiDAR and machine learning, pixel products, government-submission polygon inventories, and traditional ground sampling — calibrated to your land base, objectives, and required accuracy level.

why organizations trust us
Program Depth and Scale Across North America
Forsite's inventory work spans decades and operational forestlands across the U.S. and Canada. The programs below reflect sustained delivery capacity — not peak project numbers.
Billions of trees measured with LiDAR
21 U.S. states and 9 Canadian provinces.
With operational forest inventories.
Nearly 1 million combined acres of land in US with inventories measured supporting prescriptions for our client base.
160,000
miles
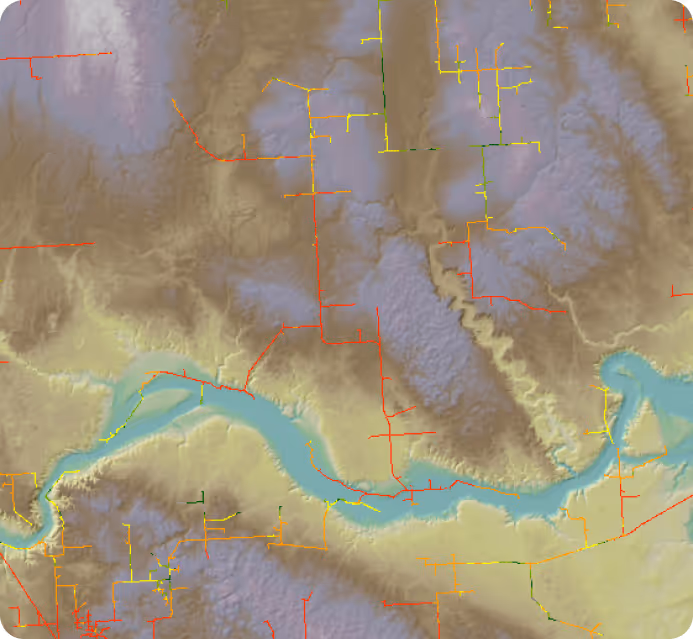
Utility line vegetation management inventory using the Tree ID tool in ForestView®.
100M
Hectares
Over 100 million hectares (250 million acres) of forest analyzed across North America – ForestView® natural landscape resource inventories and analytics.
.svg)
Four Inventory Approaches, Matched to Your Objectives
The right inventory method depends on your land base, budget, required accuracy, and how the data will be used. Forsite delivers all four — and often combines them to get the best result at the best cost.
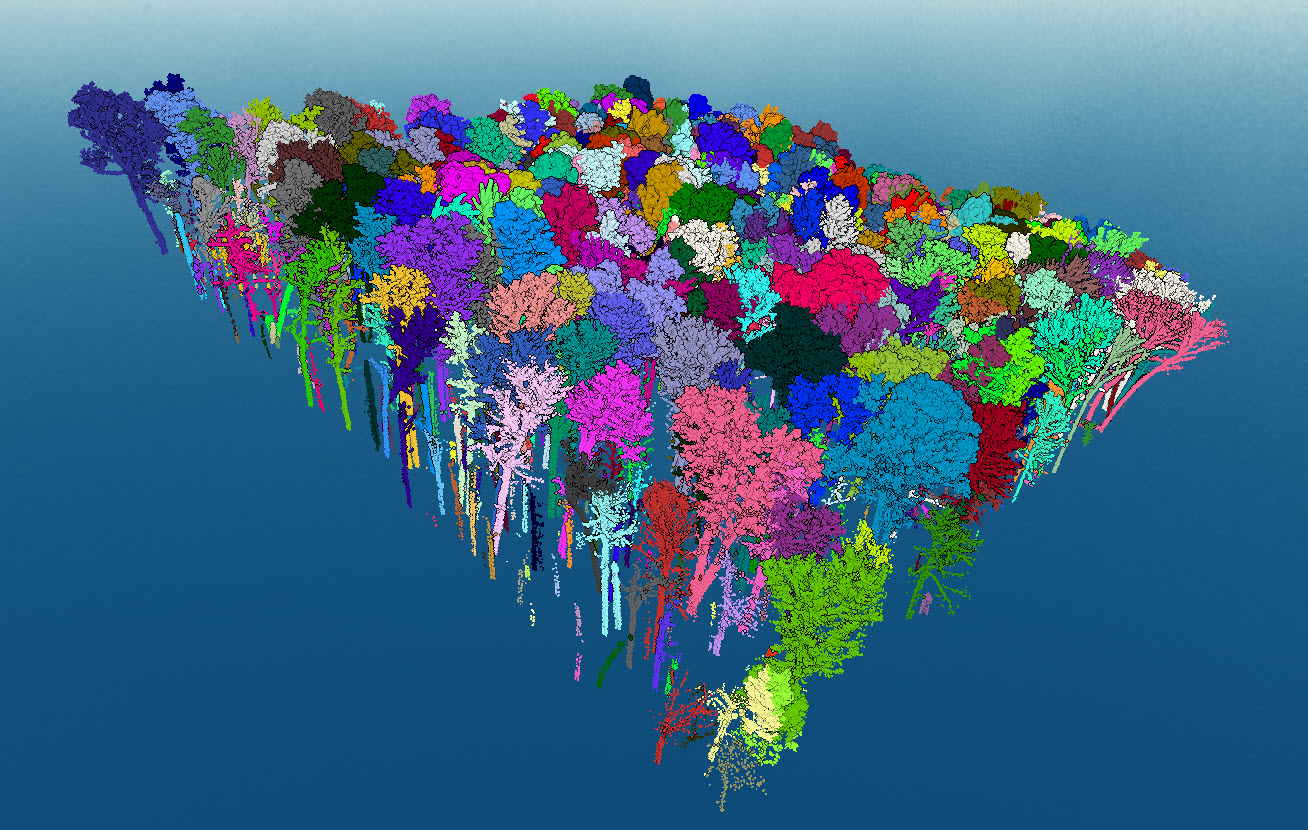
Individual Tree Inventory (ITI) — Digital Inventory™
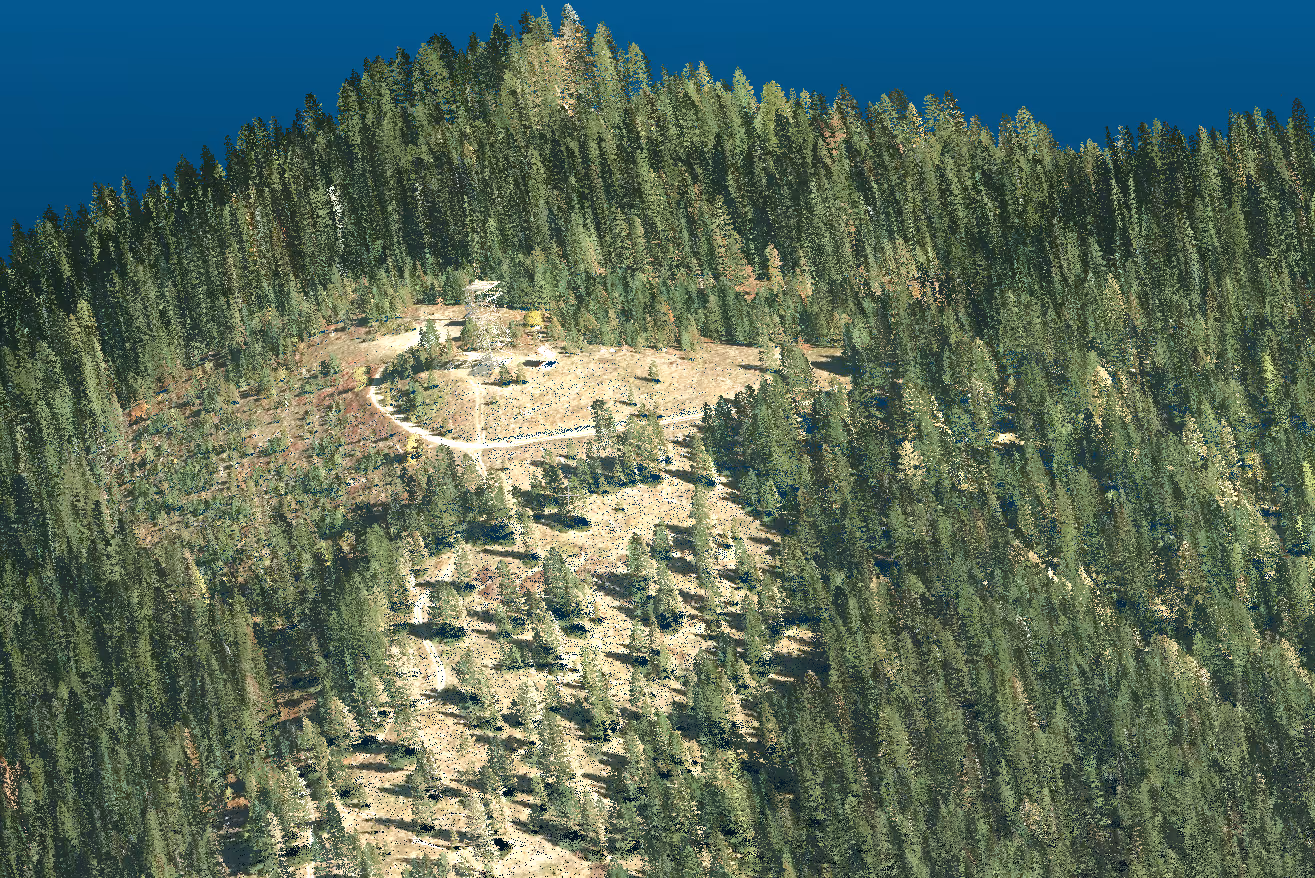
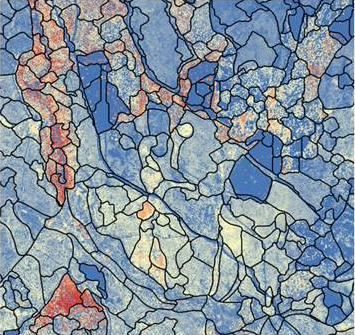
Individual Tree Inventory uses LiDAR point cloud segmentation and machine learning to describe individual trees > 5m tall across your landscape — species, height, diameter, crown area, volume by product class, and biomass. It is the foundation of Forsite's Digital Inventory™ products, delivered through ForestView®.
ITI provides a spatial resolution and attribute richness that no sampling-based method can match at scale, with accuracy levels to support it.
Per-tree attributes: species identification, height, DBH, crown extent, and product volumes
Product merchandising (virtual bucking) can be customized in real time
Stand summaries derived from individual tree data — statistically more precise than area-based models
Outputs suitable for input into G&Y tools or harvest block planning or government polygon submissions
Area Based Approach to Enhanced Forest Inventory
Area-based LiDAR and spectral modeling calibrated with ground plots produces stand-level attributes — height, volume per hectare, basal area, biomass, stocking, and species composition — across a wall-to-wall coverage of your land base. Error estimates are published with every deliverable.
This approach delivers statistically defensible results at lower cost per hectare than a full ITI, making it a solid choice for large-area programs where stand-level precision is sufficient.
Wall-to-wall stand metrics: height, volume/ha, basal area, stocking, species composition, biomass, and canopy structure
Error estimates at the stand and stratum level — reported transparently for regulatory and audit review
Integration with existing forest inventories and government data standards
Outputs formatted for G&Y modeling, carbon accounting estimates, and tenure management
Learn More
Polygon Inventories
Polygon inventories derived from enhanced stand-level or individual-tree data — structured for planning, forest estate modeling, and analysis/reporting. Forsite has delivered polygon inventories accepted across multiple Canadian and U.S. jurisdictions
Polygon inventories formatted to client submission standards (e.g, BC VRI standard, TIMO/REIT specifications, etc.)
Attribution consistent with strategic planning and operational mapping requirements
Used as base data in tenure management systems
Learn More About Polygon Inventories
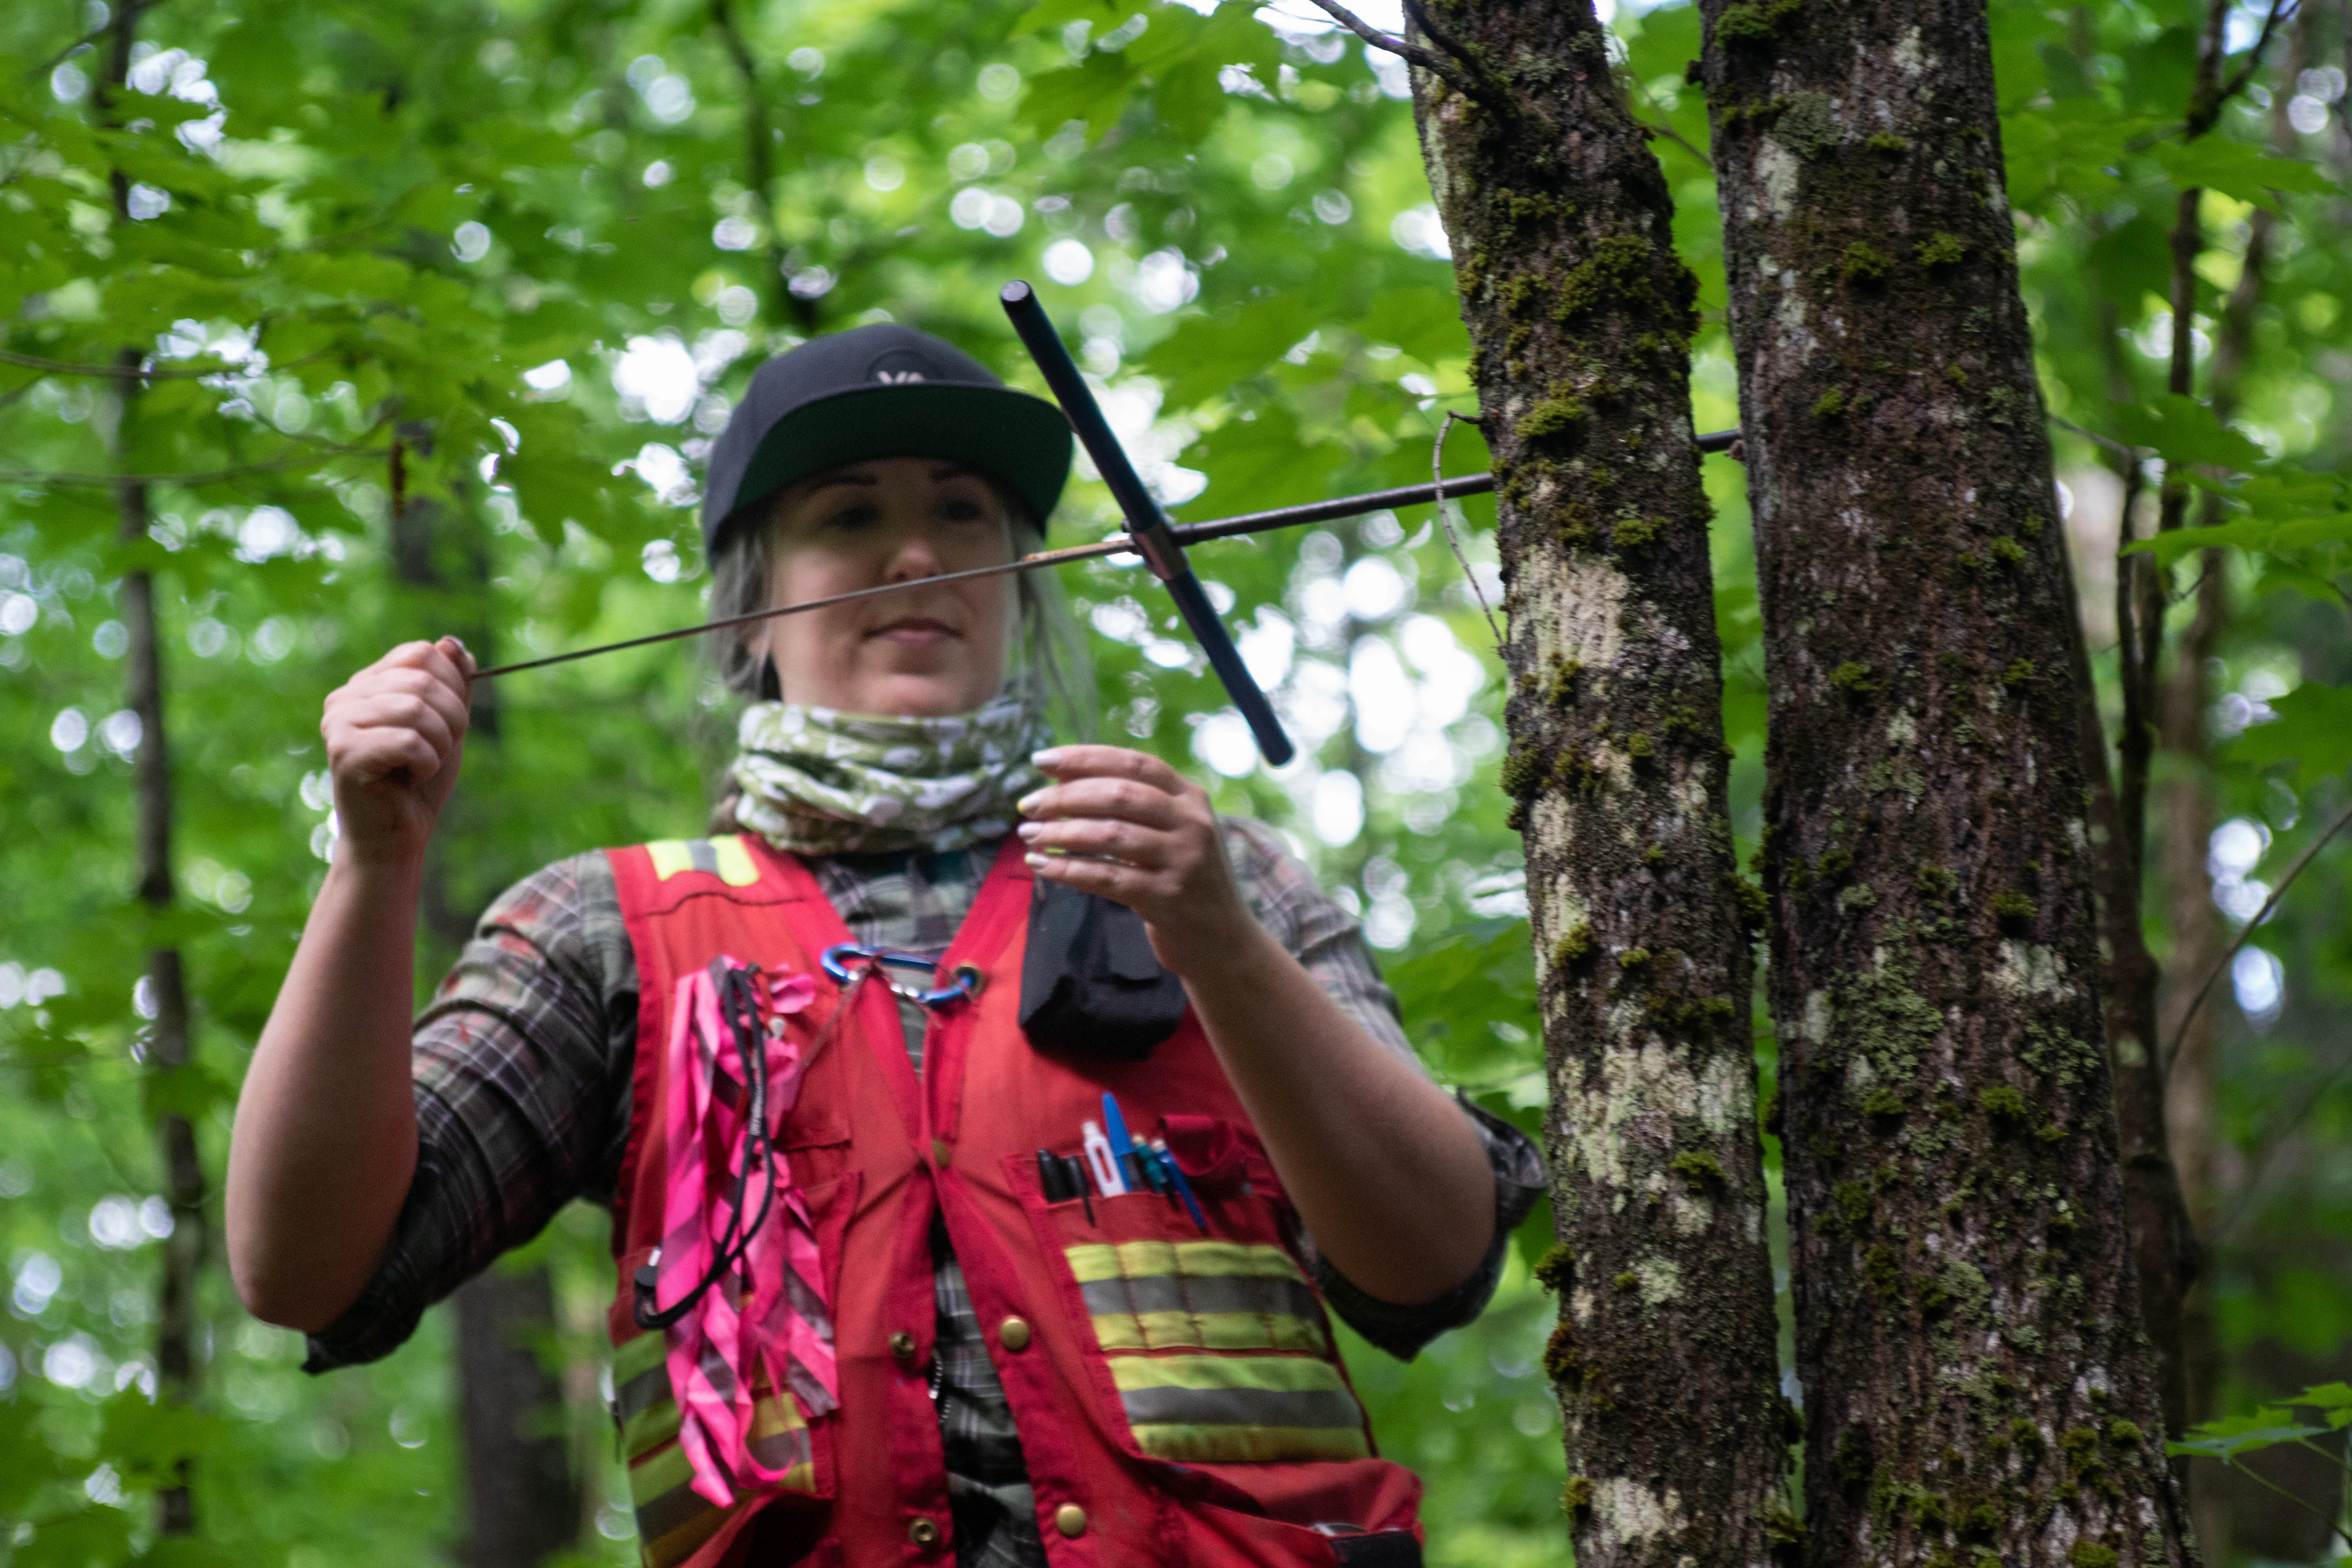
Traditional and Hybrid Sampling
Conventional plot-based inventory remains the right approach in some situations — complex tree defect requirements, very young forests, or where regulatory requirements specify ground-based methods. Forsite's field teams deliver traditional cruise design, plot measurement, and data management at scale, and combine ground sampling with remote sensing in hybrid designs where both are needed.
Traditional cruise design: systematic, stratified random, and cluster sampling approaches
CFI (Continuous Forest Inventory) permanent sample plot installation and re-measurement
Carbon plot programs to support growth calibration, offset projects, and certification
Hybrid designs integrating LiDAR or satellite data with field sampling — reducing cost while maintaining accuracy
Forsite Inventories are Built on Four pillars:
How Forest Inventory Powers ForestView® and Digital Inventory™
Digital Inventory™ is Forsite's branded LiDAR-based forest inventory product — delivered through the ForestView® platform.
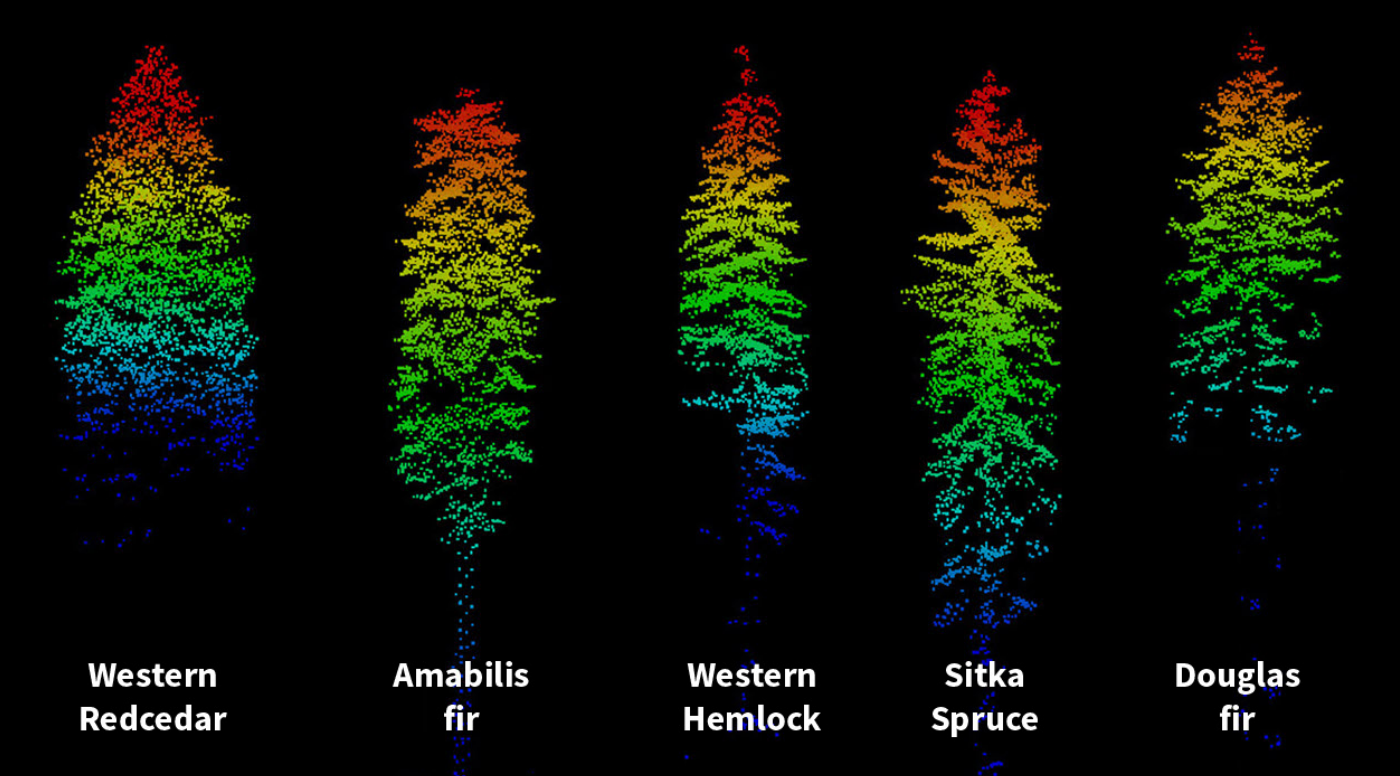
Forest Inventory services provide the field data, calibration program, professional validation, and ongoing re-measurement that keep Digital Inventory® outputs current and defensible. Forsite’s proprietary Tree ID tool makes it possible for our specialists to identify individual tree attributes including tree species.
Digital Inventory® is the product; and Forest Inventory is the professional service program that makes it work at the accuracy level your program demands.
Key Features and Benefits
Actionable insights for decision-making support and improved outcomes.
Frequently Asked Questions
What is the difference between Individual Tree Inventory and enhanced stand-level inventory?
ITI measures every tree individually using LiDAR, segmentation, and machine learning — species, height, diameter, and crown metrics for each tree. Enhanced stand-level inventory uses area-based LiDAR modeling calibrated with ground plots to produce area based attributes (volume per hectare, average height, species composition) across a wall-to-wall coverage. ITI is more precise for high-value stands where log products need to be identified. Enhanced stand-level is more cost-effective for large-area programs where stand-level averages are sufficient.
How accurate is LiDAR-based inventory compared to ground-based plots?
Yes, with the right calibration data and validated methodology. A LiDAR-based inventory when properly executed, will better capture variability across the forest than plot sampling because the entire forest is scanned. This wall-to-wall, high spatial resolution product effectively eliminates sampling error from that part of the inventory process. A Digital Inventory™ will not capture tree defect like ground measurements, but it more than makes up for that by measuring >80% of the trees across a land base compared to a traditional <5% sample.
When properly calibrated against measured plot data, LiDAR-based inventory produces estimates with accuracy surpassing intensive ground-based sampling, and with published error bounds at the stand level that traditional sampling often cannot provide at the same spatial coverage. Typical RMSE for total volume per area in managed conifer stands ranges from 10–20% for the population, compared to a traditional confidence error of 10-20% for only the mean. Error estimates are reported with every deliverable so clients can assess confidence levels directly.
Do your polygon inventories meet government submission standards?
Yes. Forsite has delivered polygon inventories accepted across multiple western Canadian jurisdictions. Our polygons are derived from enhanced stand-level or individual-tree data and formatted to meet VRI or other inventory standards. We document the derivation methodology so reviewing agencies can assess the data lineage.
What data do we receive with a forest inventory program?
Deliverables depend on the method and program scope. Standard deliverables include: spatial data layers (polygon and raster formats), attribute tables with all measured and modeled variables, error estimate tables by stratum and stand, a technical methodology report, and a calibration data summary. For Digital Inventory™ programs, outputs are also available through the ForestView® platform. We agree on deliverable formats at program scoping.
Can you support carbon inventory and CFI plot programs?
Yes. We design and deliver Continuous Forest Inventory (CFI) permanent sample plot programs for growth calibration, carbon accounting, and certification requirements. For carbon programs, we structure plot designs and measurement protocols to meet the specific requirements of the program your project is registered under — whether voluntary or compliance. Plot data can be integrated with Digital Inventory™ outputs for comprehensive carbon stock and change accounting.
How do you handle inventory programs in remote or difficult terrain?
LiDAR-based methods reduce the ground access burden significantly — wall-to-wall coverage is achieved from the air, and ground crews are deployed for calibration plots rather than full cruise coverage. For terrain where even calibration access is limited, we design statistically valid sampling strategies that minimize ground effort while maintaining the precision levels the program requires. We have delivered programs in remote BC, Alberta, and northwestern U.S. terrain.
.avif)
Need a Defensible Inventory?
Tell us about your land base, your objectives, and the decision your inventory needs to support — whether that's a timber supply review, a carbon program, a development permit, or a strategic investment. We will scope an inventory approach that matches your accuracy requirements and program timeline.