.avif)
.svg)
Utilities Monitoring
Vegetation & Wildfire Risk Monitoring with LiDAR, Analytics, and RiskView™
for Electric Utilities
Detect encroachments, model wildfire risk, and prioritize maintenance work with high-density LiDAR and multispectral imagery, advanced vegetation analytics, and the RiskView™ risk command center for operations.

why organizations trust us
Built for the Scale and Regulatory Complexity of Utility Networks
High-accuracy LiDAR, large-area collection capacity, and purpose-built wildfire risk workflows help utilities meet safety and regulatory goals — while building the data foundation for smarter long-term operations.
Faster, cost-effective
LiDAR collection to update ROW encroachment mapping and line sag assessments.
Wildfire risk identification
Wildfire risk identification and modeling to guide O&M, recloser blocking, EPSS and PSPS decisions.
maintenance cycles optimization
Vegetation inventory and growth forecasting to optimize maintenance cycles.
Dynamic risk scoring
RiskView™ risk monitoring and command center with dynamic risk scoring and automated alerts.
.svg)
Purpose-Built Capabilities for Electric
Transmission and Distribution
Each capability is designed to integrate with utility
operations workflows — not to generate reports that sit in a folder.
Vegetation Analytics and UVM (Utility Vegetation Management)
We use individual-tree metrics to catalogue species, health, and location — prioritizing maintenance by risk and forecasting growth into the future.
Plan vegetation work usign intrusion codes, tree health, and hazard proximity
Forecasting capabilities to identify fast-growers likely to breach clearances before the next cycle
Target high-value spans and structures to reduce outages
Wildfire Risk Modeling and Decision Support
Integrated fire weather, fuels, and fire behavior modeling to quantify ignition potential, fire growth, and consequences – supporting long-term mitigation planning and real-time operational decisions aligned with defined thresholds.
Identification of highest-risk assets to prioritize mitigation and treatment
Dynamic fuels and asset data to reflect current conditions and post-treatment updates
Forecast-driven situational awareness (weather, fire behavior)
Alerts and dashboards to guide recloser blocking, EPSS, PSPS, and crew dispatch
Regulatory support and defensible documentation of risk-based decisions
Key Features and Benefits
Purpose-Built for Utility Corridor Management.
case study
Protecting the Grid: Forsite's Science-Based Approach to Utility Wildfire Risk
Forsite delivers rigorous, data-driven Wildfire Management Plans that help utility providers protect their assets, ensure operational continuity, and mitigate wildfire risk.
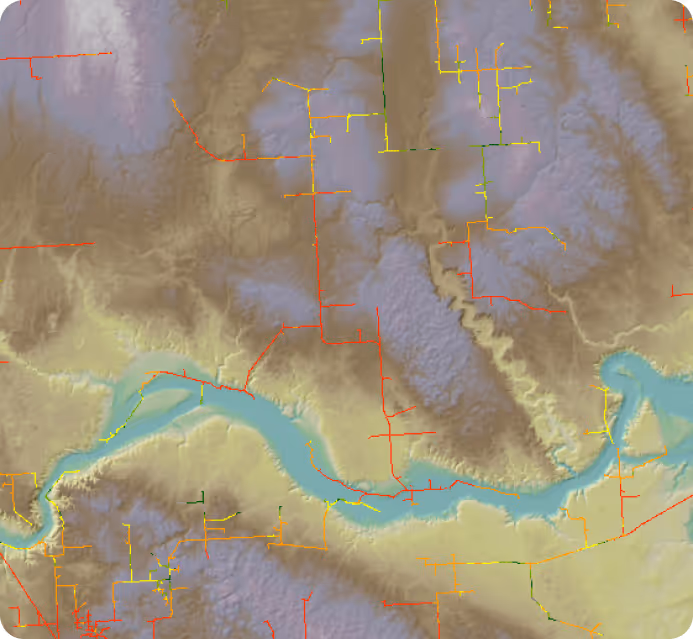
Province/territory-scale wildfire risk assessments for utility infrastructure
Combines desktop analysis, field validation, and wildfire spread modeling
Integrates Forsite's Fuel ID tool for current, validated and high-resolution fuel mapping
Daily wildfire risk updates to support real-time operational decisions during fire season
Covers Western and Eastern Canada—ongoing since 2019
Read the Full Case Study
Frequently Asked Questions
What specific problems does LiDAR solve for utility vegetation management?
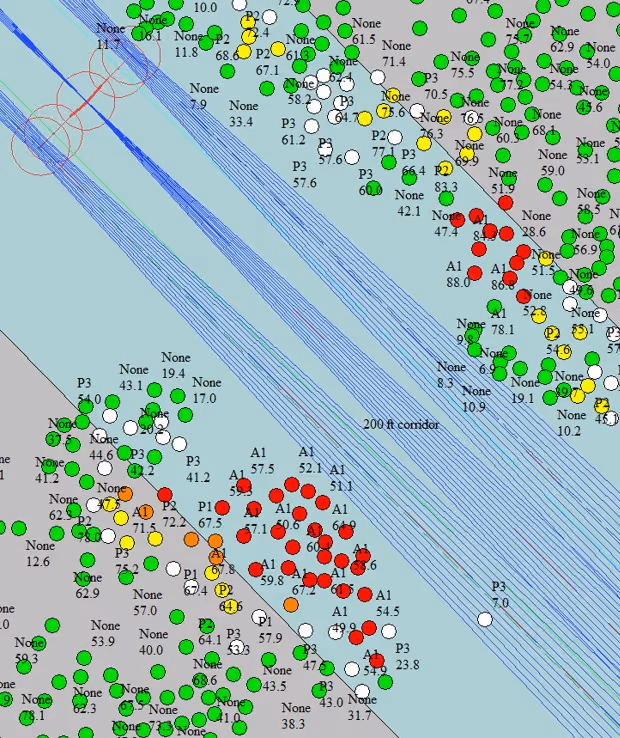
LiDAR gives you a three-dimensional, measurable record of every tree and utility asset in your corridor. That means accurate encroachment detection with intrusion codes, modeled line sag and clearance analysis under varying load conditions, tree lean and failure risk assessment, and precise asset mapping — all from a single collection flight. It replaces ground-based surveys that miss canopy hazards and helicopter surveys that lack point density for individual tree analysis.
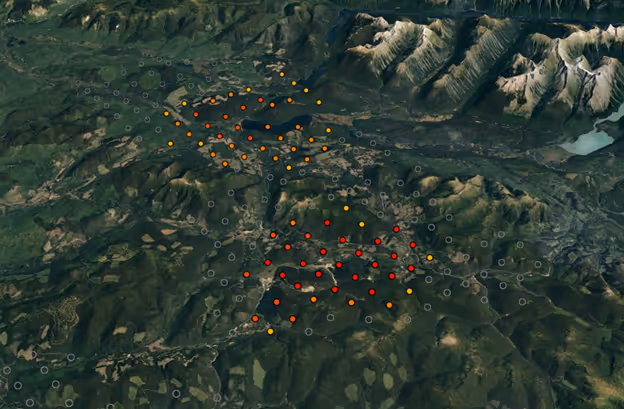
How do you score wildfire risk for utility assets?
We assess wildfire risk as a function of ignition probability and consequence. Ignition probability reflects the likelihood of a fire starting, informed by asset failure potential and fuels characterized through our Fuel ID tool. Consequence assumes a fire has occurred and spread, using fire behavior modeling to simulate fire growth and overlay predicted fire perimeters with values at risk (e.g., infrastructure, customers, surrounding assets). These components are combined into a risk score at the span or structure level to support mitigation prioritization and real-time operational decision-making aligned with defined thresholds.
How does Forsite detect encroachment and assign intrusion codes?
LiDAR point cloud data is processed to separate vegetation returns from conductor and structure returns. Trees within minimum approach distances are identified and assigned intrusion codes based on clearance violation severity — immediate, near-term, and future cycle. Each coded tree is geotagged, linked to imagery where available, and delivered in a work management format your field crews can act on directly.
Can you integrate with our OMS, GIS, or work management systems?
Yes. We integrate with ESRI ArcGIS (Online and Pro) and share data via standard formats including geodatabase, shapefile, and GeoJSON. API-based data exchange is available for clients who want to push RiskView™ risk scores or vegetation analytics directly into their own operations systems. We work with your GIS and operations management teams at project start to agree on deliverable formats and integration points.
What is RiskView™ and how is it different from a standard dashboard?
Forsite operates across Canada and the United States. Forestry teams are based in British Columbia, Alberta, Saskatchewan, Ontario, New Brunswick, Idaho, and Washington. Aerial patrol operations run from 12+ strategic bases across the continental US, with LiDAR acquisition capability deployed coast to coast. RiskView™ is a purpose-built situational awareness platform for utility operations — not a general-purpose analytics tool. It integrates precision fire behavior modeling with enhanced fuels (via Fuel ID) and high-resolution weather forecasting, alongside asset data, grounded in scientific frameworks and informed by subject matter expertise and local knowledge. Unlike standard dashboards, RiskView™ updates dynamically as conditions change and evaluates risk at specific asset locations, triggering alerts when defined thresholds are exceeded. This enables operators to identify where and when to act before an incident occurs, supporting proactive operational decision-making.
How often should utilities collect LiDAR data for their transmission network?
Cadence depends on vegetation growth rate, terrain, and your regulatory requirements. High-growth regions and high-risk corridors typically benefit from annual collection. Lower-risk segments can often be managed on 2–3 year cycles. Forsite's vegetation growth models — built from your own historical collection data — can help optimize cadence to balance cost against risk exposure over time.
.avif)
Ready to Reduce Outages and Ignition Risk?
Let's align data, models, and operations to your network and regulatory requirements.