.svg)
Forsite | Contributed Article for Wildfire Resilience and Awareness Week, May 4–8, 2026
In much of Canada, provincial and territorial fuel classification layers are built on vegetation inventory information that can be many years out of date. The inputs behind those layers are often unvalidated and the conditions they describe may not reflect current reality.
Wildfire behaviour is greatly affected by fuel loading, structure and condition, and wildfire managers rely on Canadian Forest Fire Behavior Prediction (FBP) System fuel types being correct. Classify the fuel type incorrectly, and the wildfire behaviour and spread projections that follow can be inaccurate: flame lengths, rate of spread, and spotting distance will be incorrect. Every downstream decision built on those projections inherits the error, including suppression operations, evacuations and resource planning. These decisions impact livelihoods and have significant financial implications.
Forests change considerably over time. As an example, past harvest activity has restructured stands, and bark beetle infestations have converted millions of hectares of mature lodgepole pine into standing dead fuel. Wildfires, including the record-breaking 2023 wildfire season (which saw more area burned across Canada than any year on record), have left behind complex post-disturbance regeneration that a legacy map cannot describe. Mature conifer forests may now be dominated by standing deadwood and regenerating deciduous growth, which will produce completely different wildfire behaviour if burned again.
Provincial layers typically describe fuel type classifications but say little about the structural attributes of those fuels, and nothing about their current seasonal condition. Spatial resolution compounds the problem. Coarse polygon-based fuel type maps available in some provinces, such as British Columbia or Nova Scotia, obscure the fine-scale variation that matters where communities are most at risk: the wildland-urban interface (WUI). In other provinces such as Alberta, fuels are available provincially as 100 m resolution rasters. While a 30 m product is available from NRCAN, this product is intended for federal application and has limited provincial calibration. Additionally, the national product emphasizes accuracy of fuel types occurring in boreal regions; a forest type occurring away from many of Canada’s largest communities. In the WUI, the difference between a fuel-free buffer and a continuous shrub corridor can be measured in meters. Legacy maps cannot resolve these issues. The consequences of missing them are not abstract.
A Better Way to Read the Land
Forsite's Fuel ID tool was built to address these gaps. Fuel ID encompasses a series of machine-learning approaches that use satellite imagery and, where available, LiDAR data to generate current, validated fuel information across the full canopy-to-surface profile. It is not a single product — it is a flexible system that generates resolution-appropriate outputs depending on available data inputs and the operational question being asked. Fuel ID sits within Forsite's broader FireView™ technology suite, an integrated set of wildfire intelligence tools designed to improve wildfire behaviour predictions through better weather data, better fuels data, and enhanced wildfire spread modelling with PYroCell.
Where legacy provincial maps rely on decades-old photo interpretation, Fuel ID draws on current remote sensing inputs. Even our satellite-only approach provides substantial improvements over outdated photo interpreted datasets. Where LiDAR is also available, the depth of information increases considerably. The three product types generated by Fuel ID reflect this range.
FBP System Fuel Types
The most foundational Fuel ID product is a current, spatially accurate FBP System fuel type map. This is the input that the current generation of Canadian wildfire behaviour models require — the classification that determines predicted flame length, intensity and rate of spread. Fuel ID generates FBP fuel type maps at resolutions from 100 m down to 10 m, depending on the data available and the application. LiDAR improves accuracy where it is available, but it is not required and satellite-derived spectral data alone is sufficient to generate a fuel type map that is substantially more current and accurate than most provincial layers.
Post-disturbance landscapes like burn scars, harvested blocks, and beetle-killed stands are among the most poorly served by legacy mapping. The Grand Cache, Alberta comparison below illustrates this directly: the provincial FBP fuel type layer assigned a single uniform fuel type to an entire large burn scar and carried visible straight-line boundaries where different provincial datasets had been joined. Fuel ID resolved that same burn scar into a realistic mosaic of post-disturbance fuel types and eliminated the artificial boundaries entirely. For a planner or wildland fire manager working in that area, the two maps are not interchangeable.
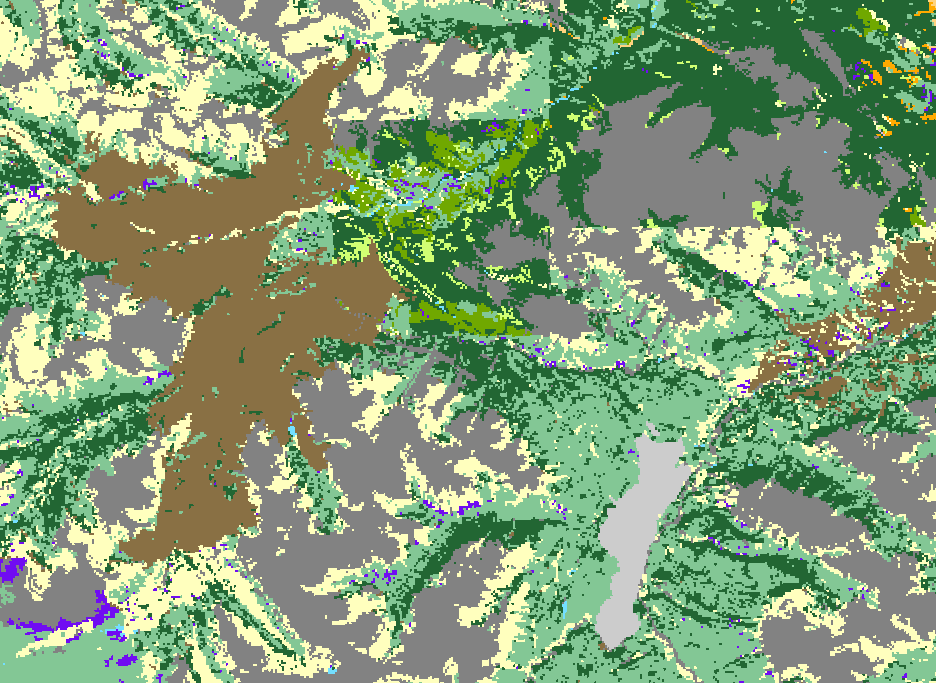
Figure 1a. Current Alberta Fire Behaviour Prediction System (FBP) Fuel Type Map of the Grand Cache area in Alberta. A large burn scar is visible as dark brown uniform fuel type. Straight lines showing artificial changes in fuel types are visible, resulting from combining different provincial data sets.
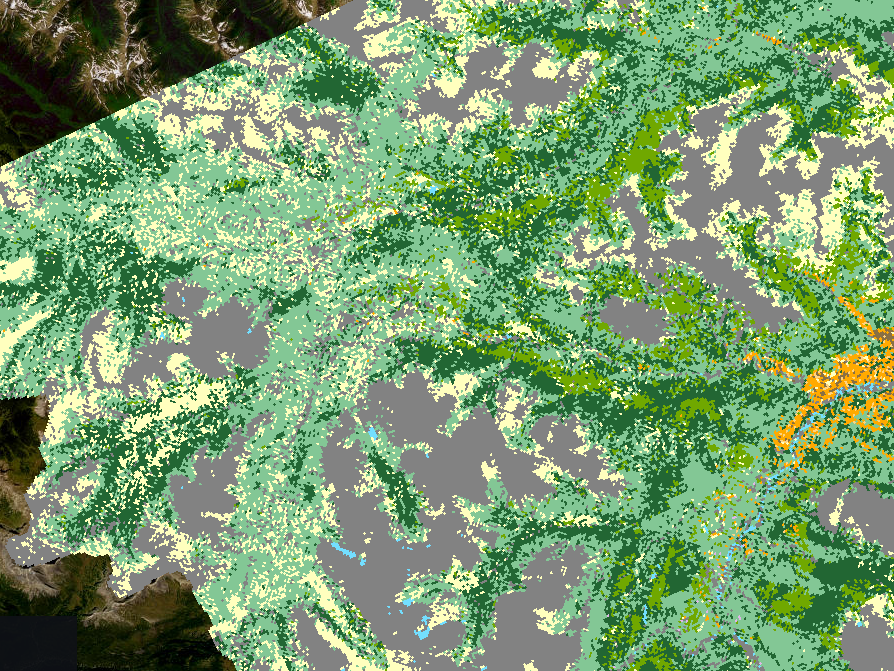
Figure 1b. Fuel ID FBP System Fuel Type Map of the Grand Cache area in Alberta. The fire scar is mapped as more representative fuel types following the disturbance. There is also continuous fuels mapping with no artificial lines from combining different provincial datasets.
Fuel Attributes
Beyond fuel type classification, Fuel ID can quantify detailed fuel attributes that describe the physical structure of the forest across the full vertical profile — from canopy to surface. These attributes are the inputs that support more advanced wildfire behaviour applications: canopy bulk density, crown base height, ladder fuel density, duff bulk density, litter biomass, dead woody debris, and more. In total, Fuel ID can predict 56 distinct fuel attributes.
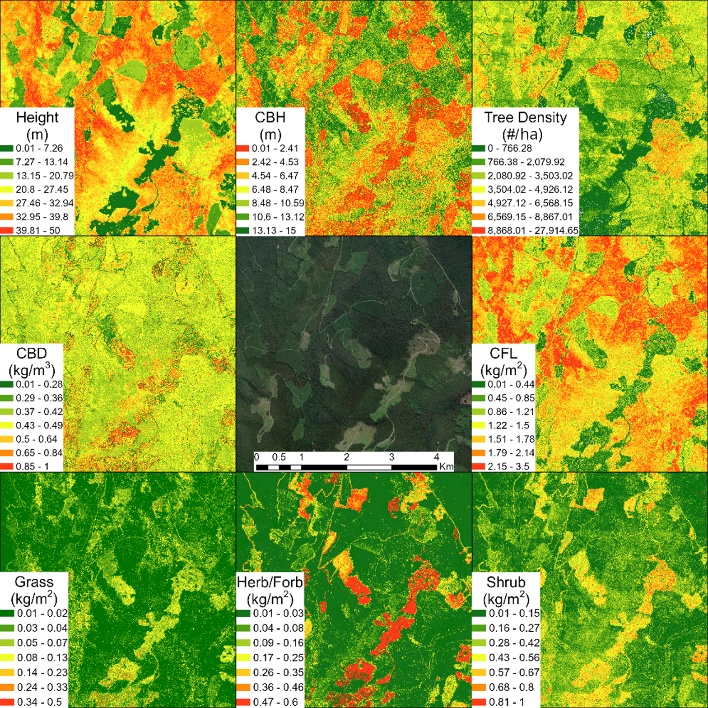
Figure 2. Using LiDAR, Fuel ID predicts distinct fuel attributes.
This product type does require LiDAR. LiDAR provides the three-dimensional measurements of stand height, canopy closure, and vertical structure that make it possible to model surface and understory conditions that no satellite sensor can resolve. The result fills a persistent gap: surface fuel and understory structure mapping has historically been unavailable at the resolution and accuracy that operational planning requires. For communities and wildland fire managers prioritizing treatment locations by identifying where ladder fuels need to be removed, or where a fuel break would be most effective — this level of structural detail changes what is possible.
Dynamic Fuels
The third product type addresses something neither legacy maps nor static remote sensing can provide: the current fuel condition at a point in time. Grass curing state, green-up timing, snow cover, and live fuel moisture conditions all shift the wildfire behaviour picture significantly across the season. A treatment prioritized in early spring looks different against late-summer cured grass conditions. A fuel type that is relatively benign under snowpack becomes a different risk category in July.
Fuel ID's architecture incorporates seasonal dynamics into its classifications, and this component does not require LiDAR — it is driven by current satellite-derived indices that capture live fuel condition and phenological state. For resiliency planning, this means the fuel picture can be updated to reflect actual seasonal conditions rather than relying on a static annual snapshot. For operational wildfire management, it means the inputs to a wildfire growth model can reflect what is on the ground today.
Improved Weather Database
Accurate fuel data is part of the picture. Wildfire behaviour is equally driven by weather — and the weather inputs feeding most Canadian fire growth models carry their own limitations.
Forsite's Weather Database addresses this directly. Built to a SOC 2-compliant standard, the database ingests the ERA5 reanalysis dataset from the European Centre for Medium-Range Weather Forecasts (ECMWF) and calculates Fire Weather Index System (FWIS) codes and indices across the full ERA5 coverage area, with historical records extending back to 1950. These historical codes serve as starting conditions for FWIS calculations applied to forecast weather from Environment and Climate Change Canada models, including GDPS and HRDPS, providing a continuous record from 1950 through a maximum 10-day forecast horizon at an hourly time step. Grid resolution ranges from 2.5 km to 15 km depending on the forecast model.
Critically, the calculations incorporate the latest overwintering approaches established by the Canadian Forest Service (2024), accounting for the micro-overwintering events that occur in shoulder seasons, and that static or interpolated weather station data routinely miss. The result is a weather input layer that is current, historically grounded, and built specifically for wildfire applications — a meaningful improvement over the interpolated station-based approaches that have been the default in operational fire management.
What This Means for Community Wildfire Resiliency Plans
The direct application of this work is in how communities, land managers and stewards plan and what their plans can realistically accomplish.
Wildfire resiliency planning requires significant investment: prescribed fire, mechanical thinning, hand piling, FireSmart treatments around structures, and protection of access corridors. The location of those investments is partly directed by fuel maps. Where is the highest priority fuel-based hazard? Where does treatment provide the most leverage for protecting the community? Where are the ladder fuels that would allow a wildfire to transition from the ground to torch into the canopy and become a crown fire?
If the fuel map is wrong, treatment locations and priorities can be wrong. Effort could get allocated to areas of lower hazard while real vulnerabilities go unaddressed.
Better Fuels, Better Modelling: The Downstream Effect
Improving weather datasets and fuel maps improves every downstream product and decision that depends on them.
Wildfire models used in Canadian wildfire management, including wildfire growth simulation tools built on the FBP System, require weather and fuel types as an input. Inaccurate or unrepresentative weather and fuel classifications produce inaccurate spread simulations, and those simulations drive decisions about evacuation timing, resource pre-positioning, and structure protection priorities.
This is why Forsite's investment in weather and fuel mapping connects directly to its work in wildfire behaviour modelling, through PYroCell — a wildfire growth modelling system developed from the ground-up, with support from Natural Resources Canada for feature development. Using the inputs of complex terrain, weather and fuel data, PyroCell combines the elliptical growth approaches of the Canadian Forest Fire Behavior Prediction System with an improved, time-step capable ‘Minimum Travel Time’ algorithm to simulate wildfire growth. The system has been rigorously validated against existing benchmark test cases and Canadian fire growth models, including Prometheus and W.I.S.E., and was developed in response to real operational gaps as those tools reached the limits of their support and usability.
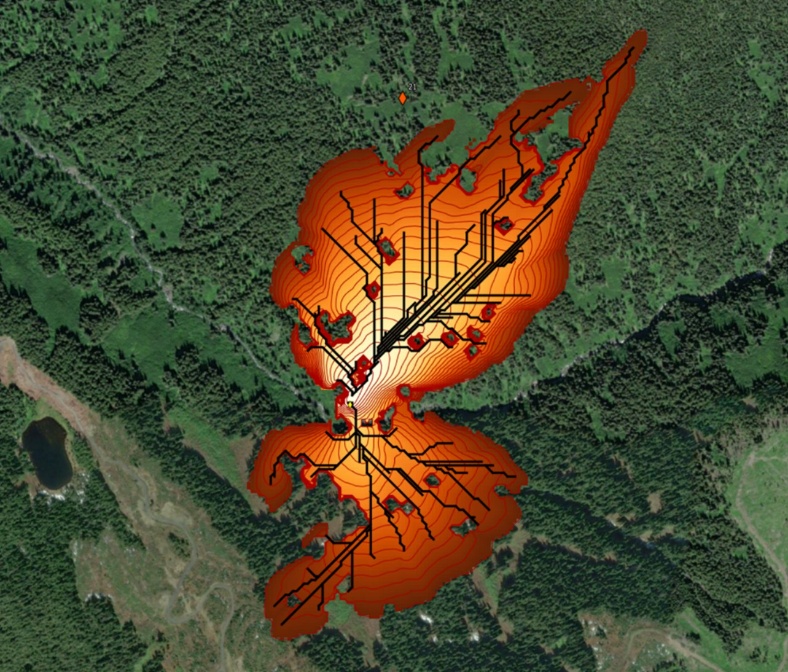
Figure 3. Example output from PyroCell, illustrating time-step perimeters and the primary fire spread pathways predicted by the model
Designed with modern software architecture, PyroCell is scalable, adaptable, and built for integration into broader workflows. Additionally, PyroCell supports multiple wildfire behaviour models (FBM), including FBP, Behave7, and Conifer Pyrometrics (ConPyro). ConPyro is a cutting-edge FBM that decouples forest structure and fuels from pre-defined fuel models, and it has been integrated into PyroCell in collaboration with Natural Resources Canada.
As the developers and subject-matter experts behind PyroCell, Forsite will continue to advance its capabilities, incorporating new research, improving performance, and supporting its ongoing evolution for both scientific and operational use. A manuscript describing the model is currently in development, with submission to a peer-reviewed journal targeted for mid-2026. Once published, PyroCell will be released as open-source software, maintained by Forsite for the broader wildfire modelling community.
Better weather and fuel datasets feeding into a better wildfire model: the compound effect of improved inputs at each stage runs through every level of wildfire management — from the resiliency strategy a community adopts today, to the real-time operational decisions a wildfire responder makes during an active event.
The Question Every Resiliency Plan Should Ask
Wildfire resilience is ultimately a community outcome. It is about people, homes, and the watersheds and landscapes that give them meaning. The planning frameworks available to Canadian communities — municipalities, Indigenous communities, and land managers alike — including CWRPs, provincial fuel management strategies, FireSmart programming, are sound. They represent genuine institutional investment in reducing risk and protecting lives.
What those frameworks need, to reach their potential, are the best available data inputs. The tools to provide those inputs now exist and are being applied across British Columbia, Alberta, and Saskatchewan, with the capacity to extend across other geographic regions.
Forsite is a Canadian natural resource management and geospatial intelligence company with offices in Canada and the US. Forsite's Fire Business Unit provides fuel mapping, wildfire behaviour modelling, wildfire risk assessment, and emergency response support services to government agencies, industry, and communities. For more information on FireView, Fuel ID, and PyroCell, contact the Forsite Fire team.
.avif)