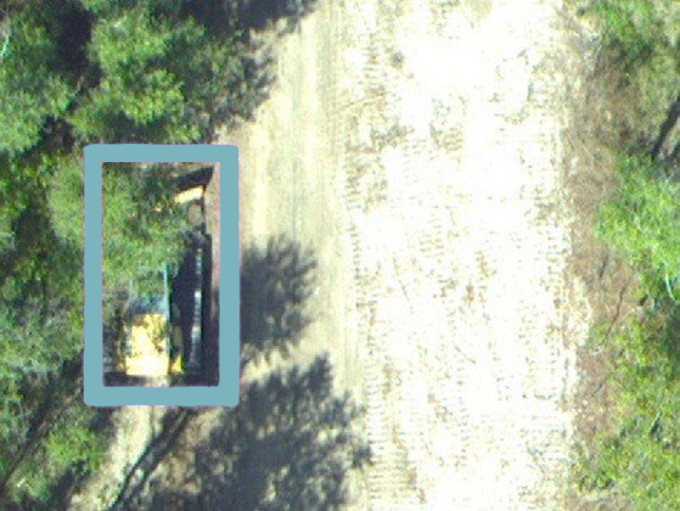
Utilities in fire-prone regions face wildfire risk from two directions at once. Their lines can start a fire, when equipment fails or vegetation makes contact under the wrong conditions. Their lines are also exposed to fires that begin elsewhere and move across the land toward the corridor. In both cases the vegetation in and around the right-of-way shapes how the risk plays out and is one part of the equation a utility can actively manage.
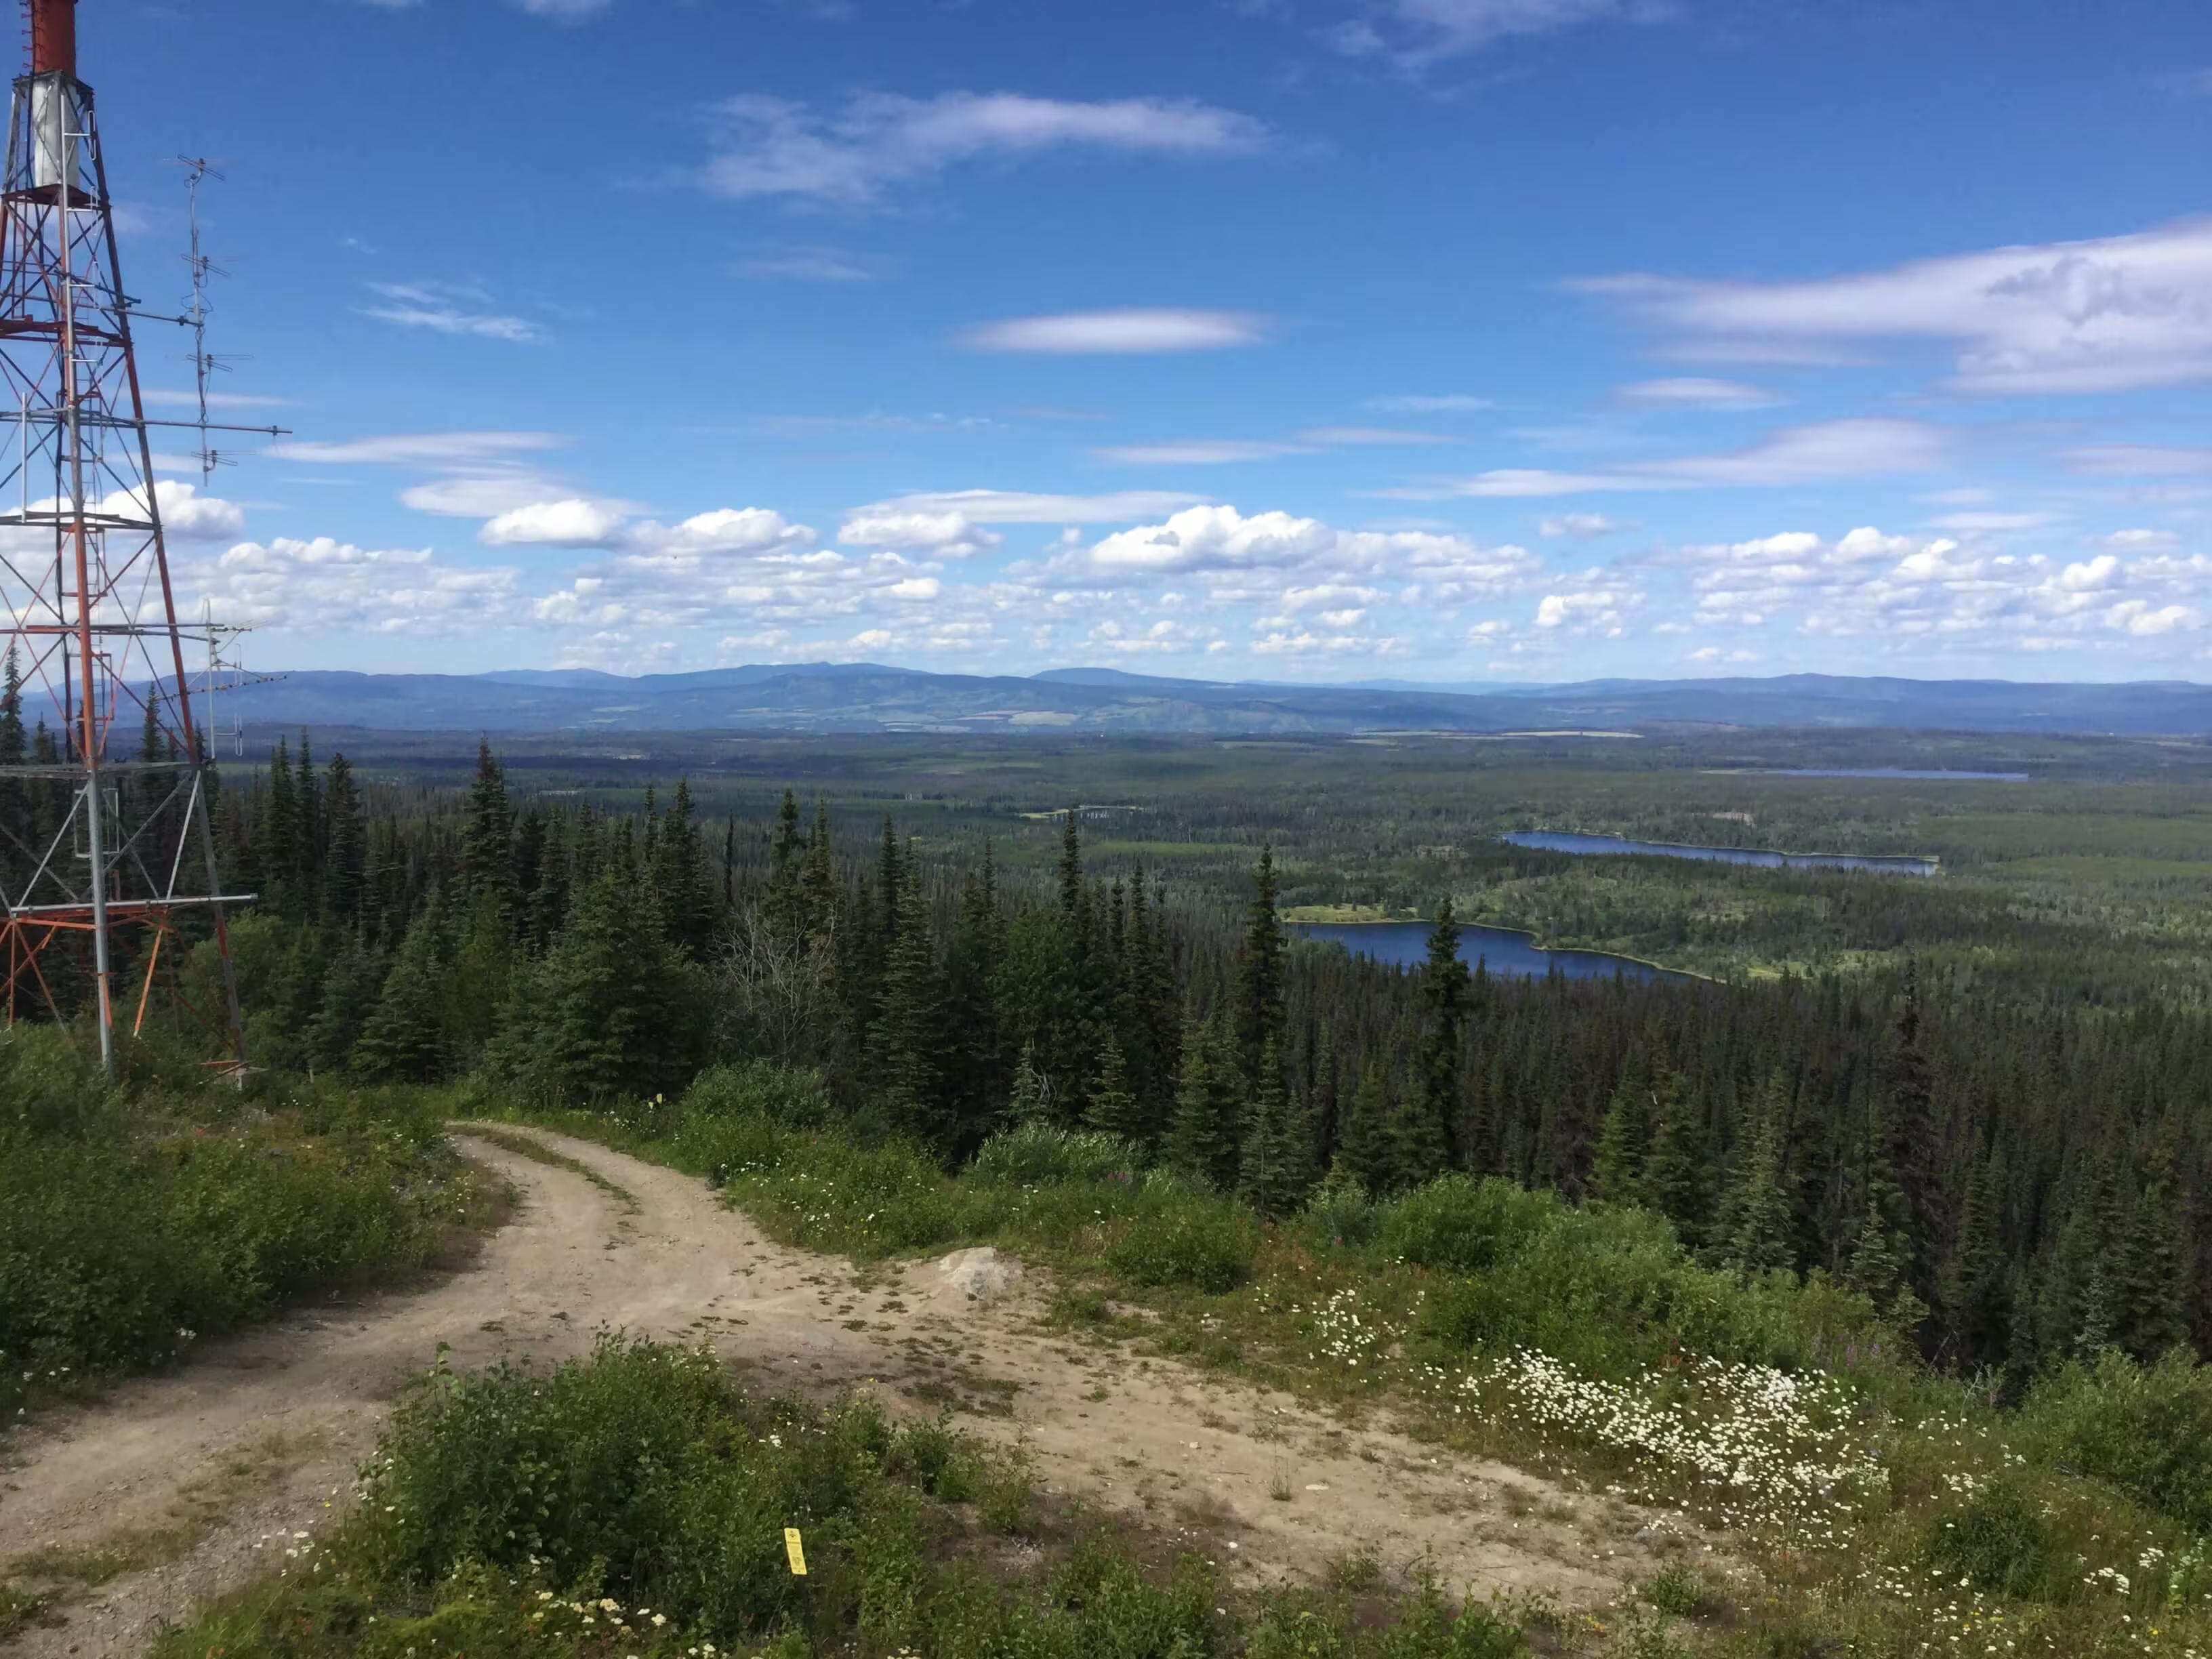
That makes vegetation management the most effective lever a utility has for reducing wildfire risk. The harder question is where to apply it. Of all the vegetation along hundreds or thousands of miles of line, which spans carry the most risk right now and deserve attention first? Answering that with confidence is what lets a cycle-based program put its effort where the risk is highest.
The way to answer it is to see the corridor clearly, and that view comes from the air. LiDAR and aerial imagery capture vegetation at the level of the individual tree across the entire system, producing a prioritized picture of where the risk concentrates. Inspecting every span on the ground doesn’t scale for a wildfire threat that covers entire service areas. Integrated vegetation management, the discipline the Utility Arborist Association has spent years advancing, becomes far more precise when it runs on that kind of intelligence. That picture is the first link in a chain that ends in a real-time read on risk across the whole network.
Seeing the Corridor, Tree by Tree
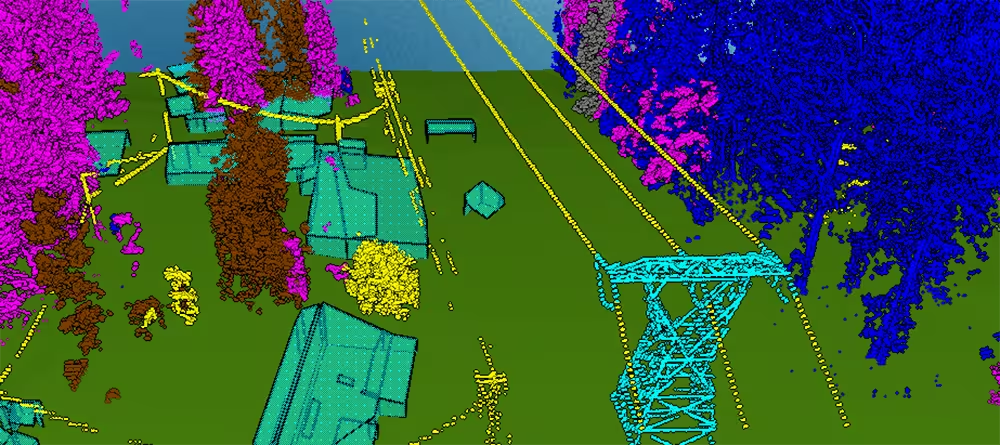
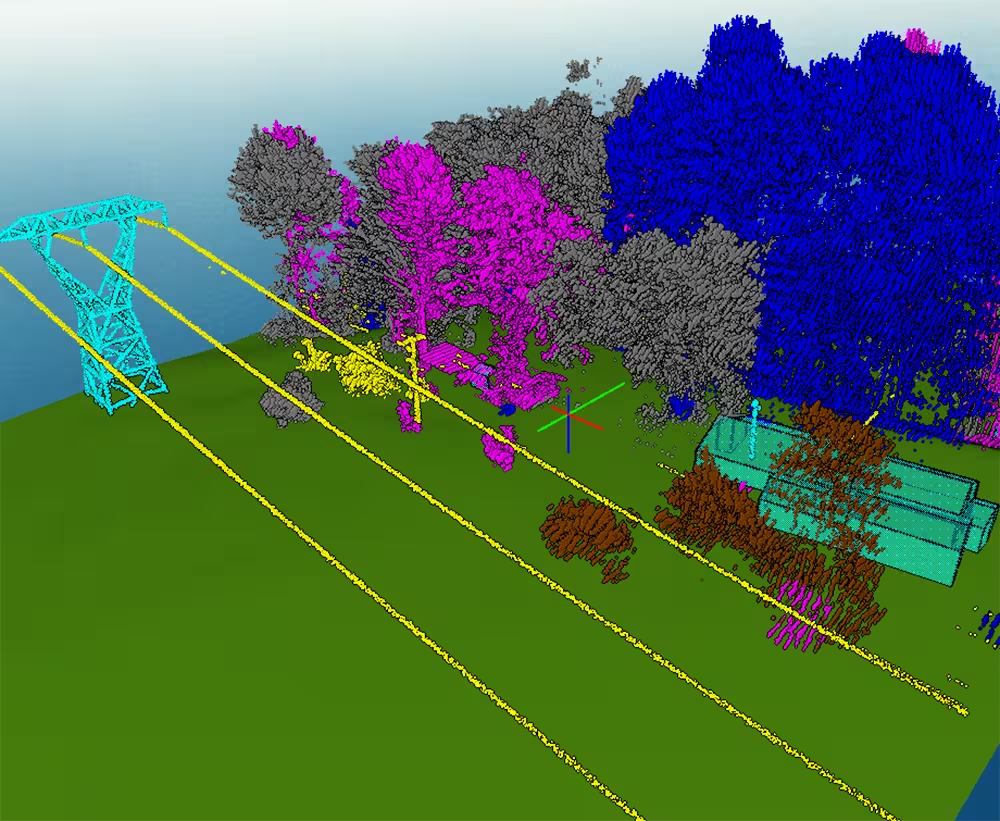
Precision aerial collection has changed what a vegetation inventory can hold. A single LiDAR and imagery acquisition covers an entire corridor, and machine learning turns that data into an attributed record of individual trees: species, height, canopy structure, and position relative to the conductor. Targeted field sampling validates the results, so the attributes hold up to the decisions that depend on them. Forsite has used its Tree ID program to inventory vegetation along more than 160,000 miles of utility lines across North America.
At that resolution, the inventory stops describing a corridor in general terms and starts describing it tree by tree. An arborist reading the data can see where vegetation has pushed into the right-of-way, which species are growing fastest, which trees are dead or in decline, and where a single failure could drop a conductor into dry fuel. The picture reflects the corridor as it stands, not as a planning assumption left over from the last cycle.
From Inventory to Priority
A detailed inventory is only useful if it changes what gets done. For most utilities, tree-level data works by refining the maintenance cycle rather than replacing it. The rotation still sets the baseline; the analysis decides what moves to the front of it. Spans where a fast-growing species is closing on an energized line, on terrain with fuels that would carry fire, near a community, rise in priority. Spans treated recently that sit in low-consequence terrain can hold their place or wait a little longer. A high-risk span can be pulled ahead of its scheduled visit, with the data standing as the documented reason. Crews and treatment dollars concentrate where they reduce the most risk instead of spreading evenly across every mile.
This is where vegetation management earns its place in the wildfire conversation. Growth prediction identifies the spans likely to breach clearance before the next planned visit. Health and decline metrics surface the trees most likely to fail. Intrusion codes flag where vegetation has encroached into the clearance zone of the right-of-way. The result is a program that can show, span by span, why a given dollar was spent and what risk it brought down. For an arborist defending a budget to a regulator or a leadership team, that traceability matters as much as the clearance itself.
Where Fuels Meet Weather
Vegetation management and wildfire risk management address different parts of the same problem. Vegetation programs reduce the likelihood of vegetation-related outages and ignitions, while wildfire risk platforms help utilities understand how weather, fuels, topography, and active fire conditions influence risk across the network.
Wildfire risk is dynamic. A circuit operating under low-risk conditions in May can face elevated exposure during a dry, wind-driven afternoon in August. Understanding that changing risk requires integrating current and forecast weather, fuel conditions, utility asset information, and fire behaviour modeling.
Forsite has built RiskView™ for that purpose. The platform combines fire weather forecasts, fuel information, asset data, active wildfire intelligence, and fire behaviour modeling to provide a dynamic view of wildfire risk across a utility network. Instead of reviewing weather, wildfire activity, and asset information across multiple systems, operations teams can assess changing conditions through a single interface designed to support situational awareness and operational decision-making.
As conditions evolve, RiskView updates risk metrics across assets, circuits, and operating areas, helping utilities identify where wildfire potential is increasing, where infrastructure may be exposed to external wildfire threats, and where operational actions may be warranted. The result is a common operating picture that supports day-to-day wildfire preparedness while complementing broader vegetation management and mitigation programs.
What It Makes Possible
The point of the chain is not the data or the dashboard. It is the decision. When vegetation intelligence and fire weather meet in one place, the decisions a utility must make under pressure get faster and better grounded.
During fire season, a team can set risk thresholds and let the system flag the circuits that cross them, then send patrols and crews to those spans first. When conditions force a call on enhanced powerline settings, a recloser, or a public safety power shutoff (PSPS), it rests on where vegetation risk and fire weather align rather than on a coarse map or a gut read.
One major Alberta transmission operator uses RiskView to anticipate where a PSPS event will be needed, and for how long, ahead of the weather. Off-season, the same record feeds capital planning, pointing mitigation dollars at the segments that drive the most risk. And because the platform keeps the modeling, thresholds, and decisions on record, the utility holds an auditable account of why it acted, which regulators and insurers increasingly expect.
None of this replaces the arborist's judgment. It sharpens it. The professional who knows the corridor is the one who decides what the data means and what to do about it.
The Arborist's Data Is the Wildfire Program
Treat that vegetation intelligence as the foundation it has become, and the wildfire program gets stronger at every level above it. Strategy improves because mitigation is directed by risk priority. Operations improve because daily decisions draw on current conditions. Compliance improves because every action traces back to evidence.
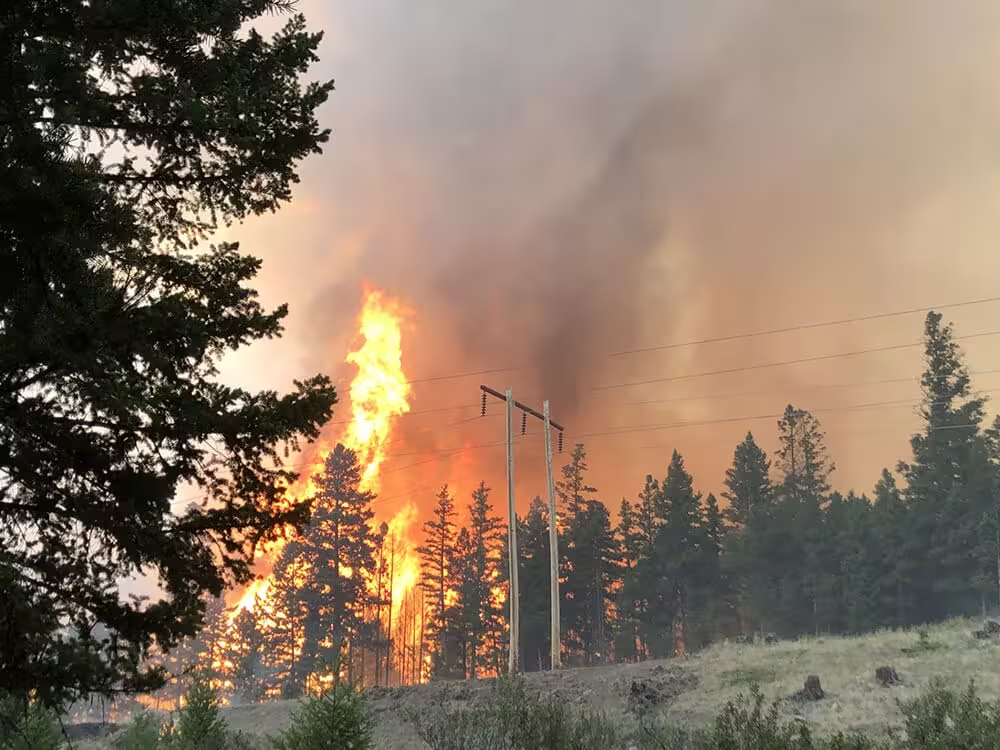
Vegetation management is the most effective way a utility can reduce its wildfire risk, both for fires that start on its lines and for fires that move toward them. Remote sensing is what makes that management precise: a clear, prioritized view of every tree, validated in the field and connected to the rest of the program. That is how a utility turns a corridor full of individual trees into a defensible read on wildfire risk, and into a grid that holds up when the season turns.