

Forsite Exchange
Digital Library of Operational Data Products
See the resources and conditions on your land. Each tree, slope, road, and stream, measured from the air. Forsite Exchange puts that detail in your hands, built on more than 40 years of natural resource management experience and the latest aerial technology. Use it to understand your property, spend less time on field surveys, and lower the cost of your next project.

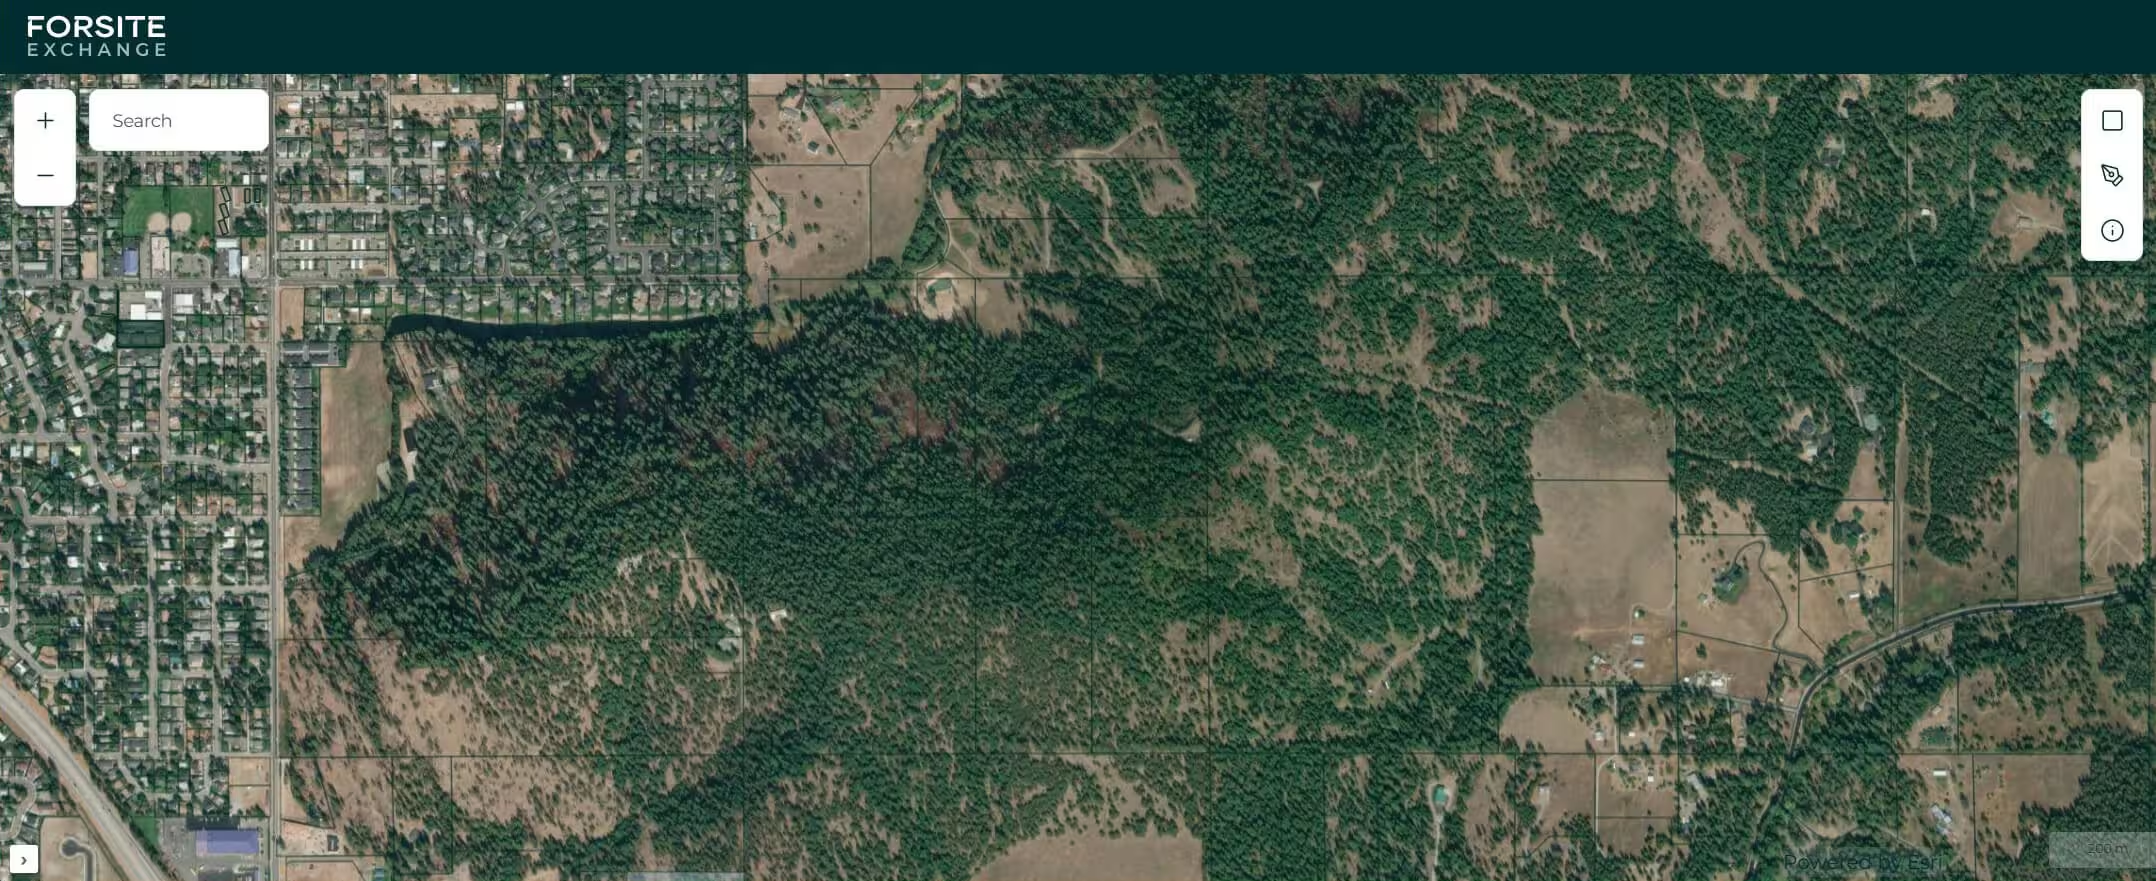
What is Forsite Exchange
A Detailed Multi-Resource Inventory, No Contract Needed
Until now, getting this kind of data meant hiring a firm to fly your land, process the data and write a report. That takes time, and it rarely makes sense for a single property or a small project.
Forsite Exchange changes that. We've already flown and processed many large areas, so the data for your land may already exist. Each product is a baseline layer that gives you information you can use and measure, like how tall each tree is or where an old road used to be.
45+
aircraft
1.2
billion acres of LiDAR collected since 2004
Under 12"
vertical accuarcy
Available Products
Landscape Intelligence Ready to Download
Layers marked "Available now" are ready today. Layers marked "Coming soon" are still being processed, and we'll tell you when they arrive if you register your interest.
Every layer is built on our ForestView® and FireView™ expertise, using the same data our team applies in forest and wildfire management.
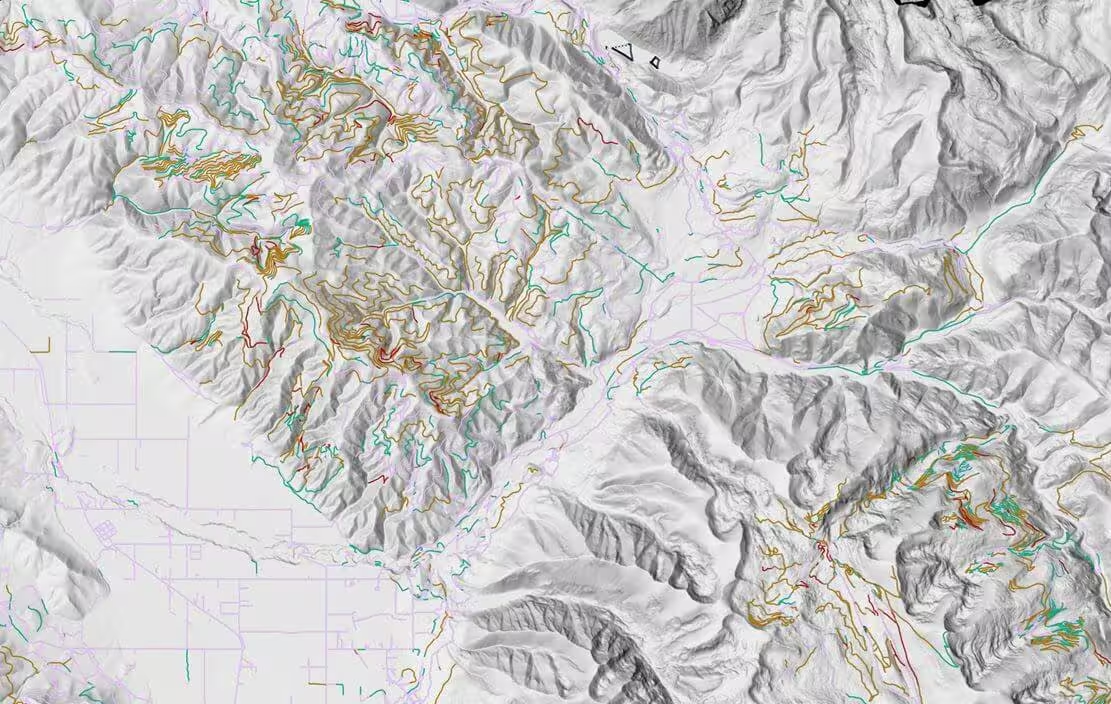
Baseline layer from ForestView®
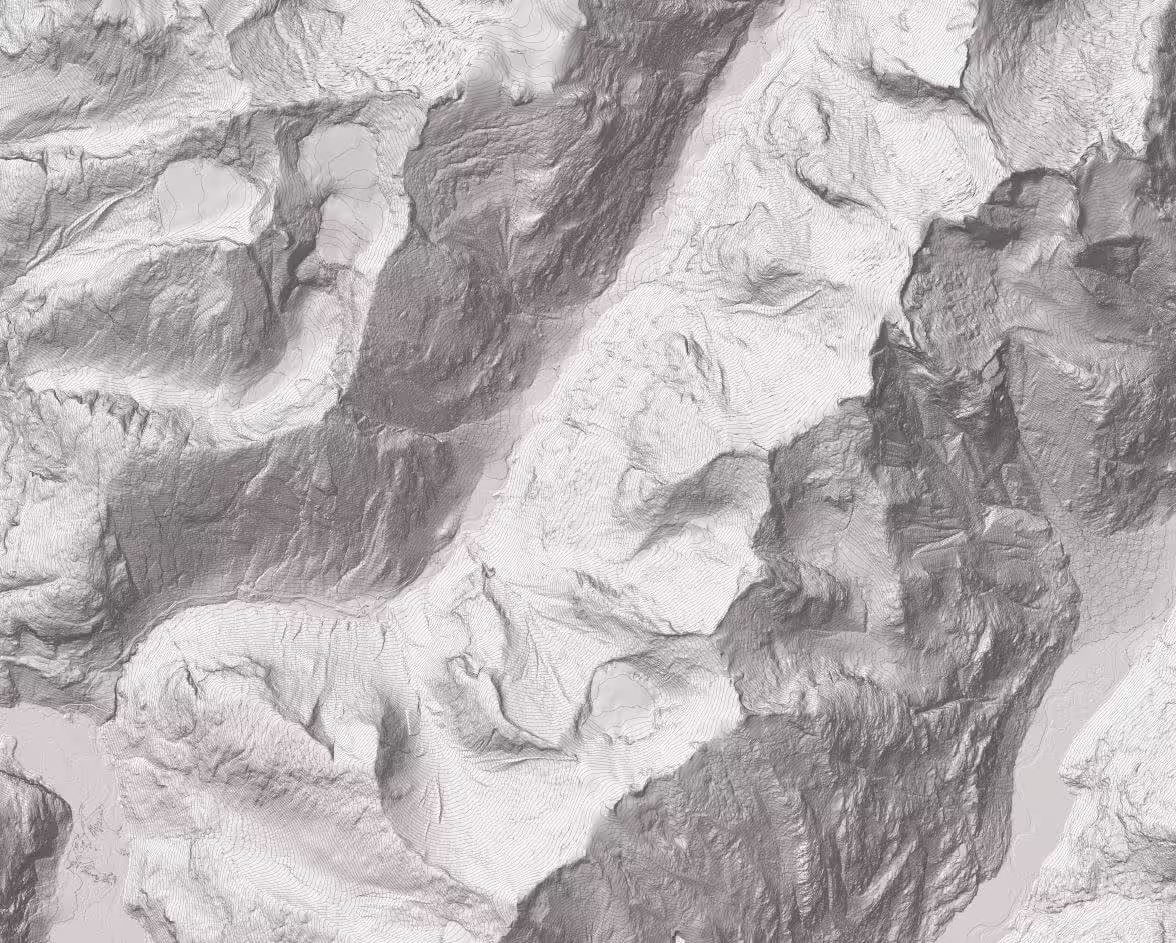
The true shape of the ground beneath the trees.
Shows slopes, ridges, and drainage across your whole area
Plan roads, harvest units, and ground projects before you head out
Find wet areas and drainages before you plan a crossing or culvert
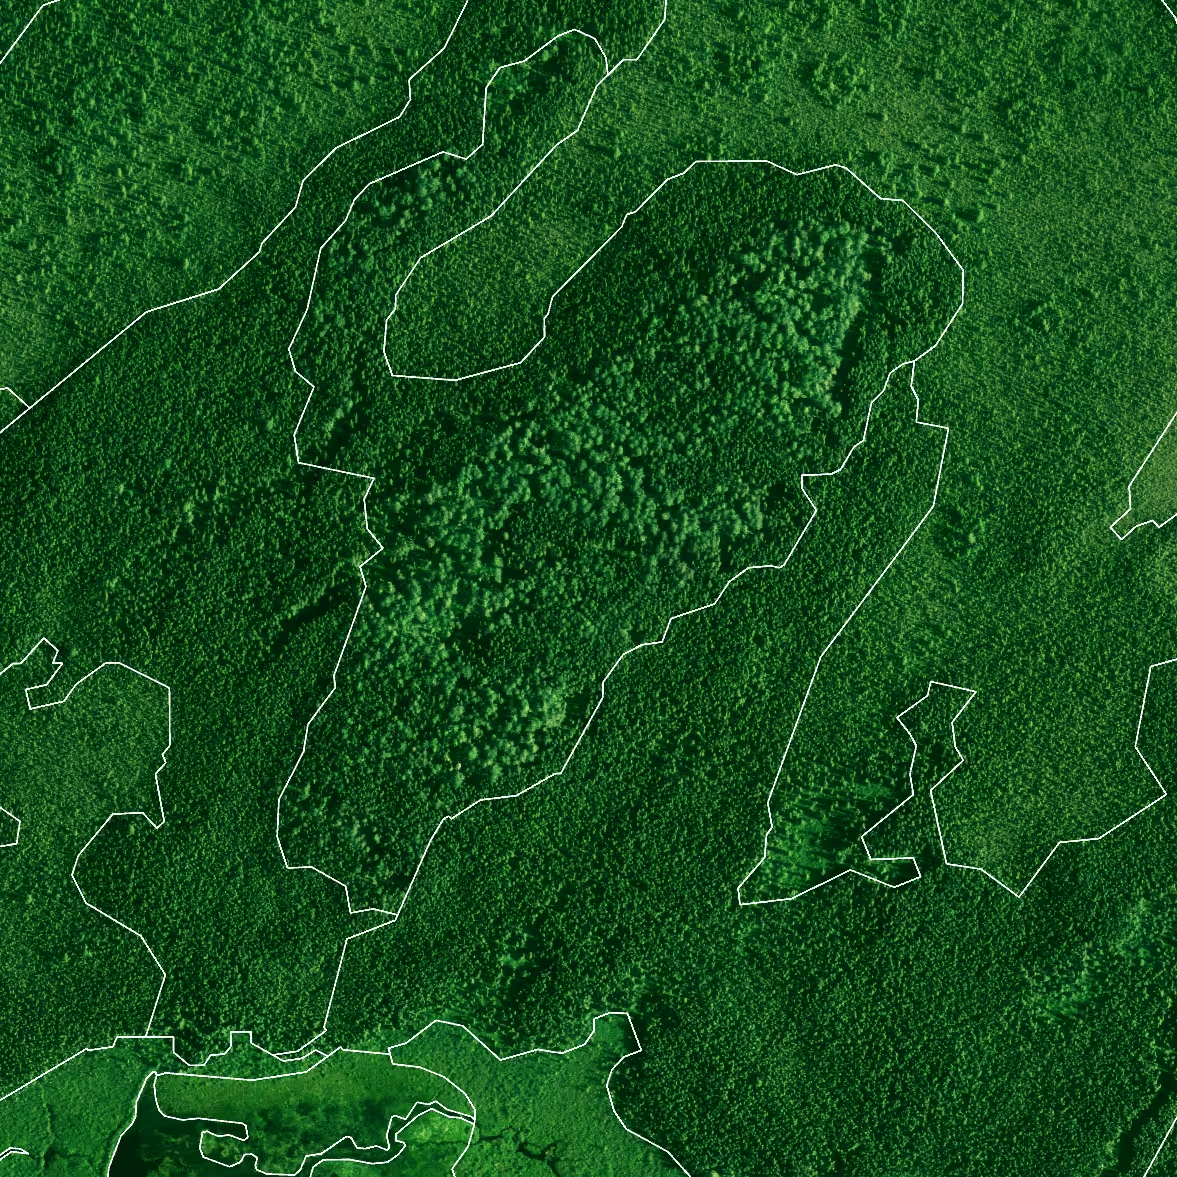
Baseline layer from ForestView®
A 2D map of tree height across your whole area.
Covers every acre, not just sample plots, with more accurate heights than satellite imagery
Spot open ground, young stands, and mature timber at a glance
See where the canopy is dense, thin, or shading a stream
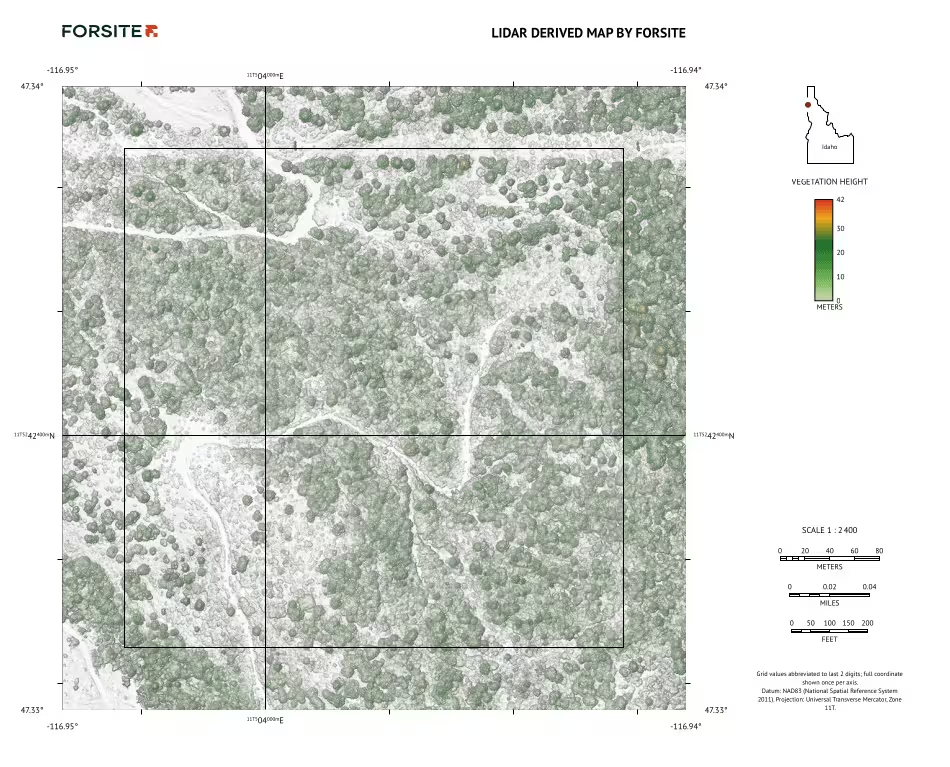
Maps you can take into the field on a phone or tablet.
Works offline in the free Avenza Maps app (free download) or other mapping apps
See where you’re standing on the map as you walk the landscape
See the landscape and buildings in 3D when planning fire protection or deciding whether to sell or buy land
Baseline layer from ForestView®
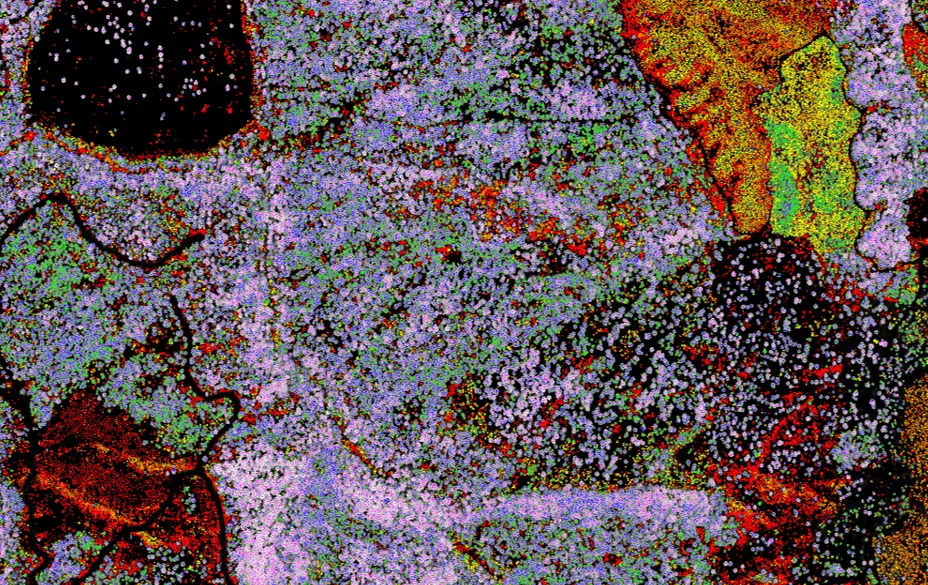
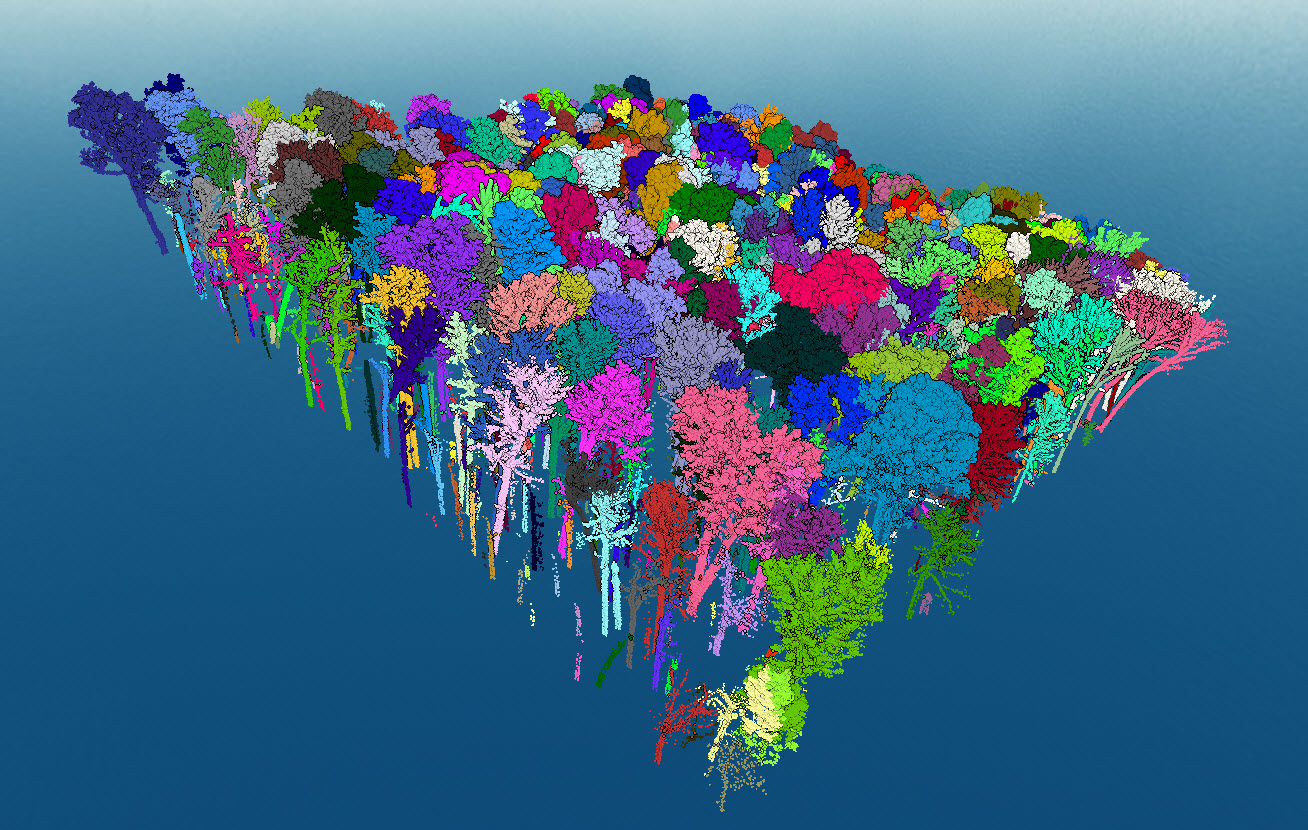
Every tree mapped from the air.
Includes height, diameter, crown size, species, and live or dead status
Value timber and plan harvests without walking every acre
Find dead trees and species changes across your property
Baseline layer from FireView™
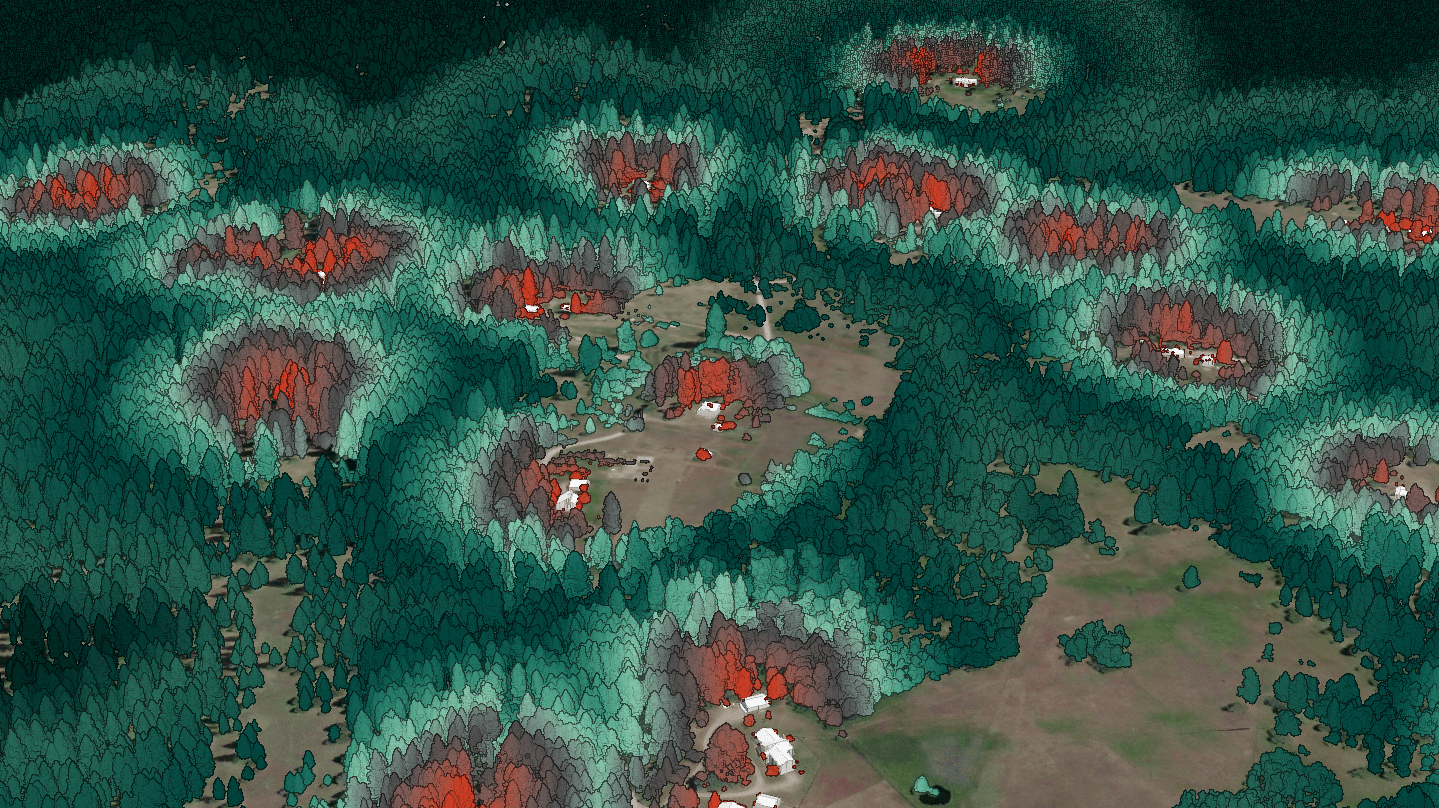
How severely fire could burn across an area.
Built from conditions we measured the day we flew, not a regional average
Maps of burn severity, referencing fuel conditions, and past ignitions around homes, roads, and natural areas
Pair it with the DEM; steep slopes with dense vegetation and nearby structures are often the first places to treat
Baseline layer from ForestView®
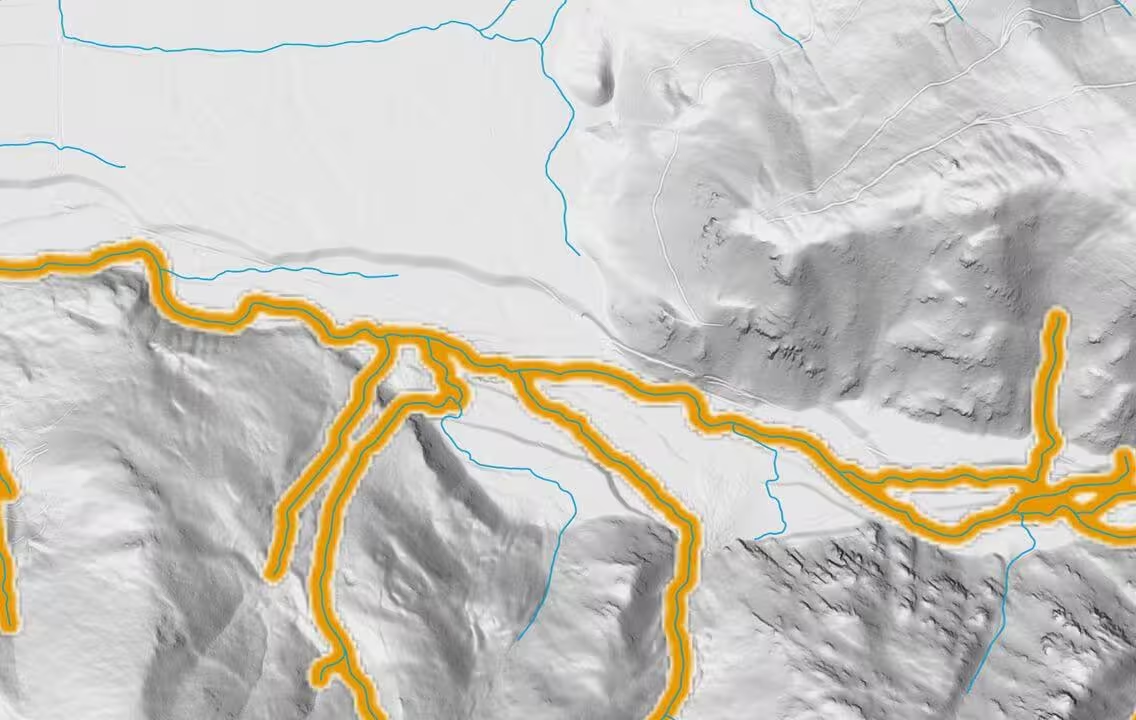
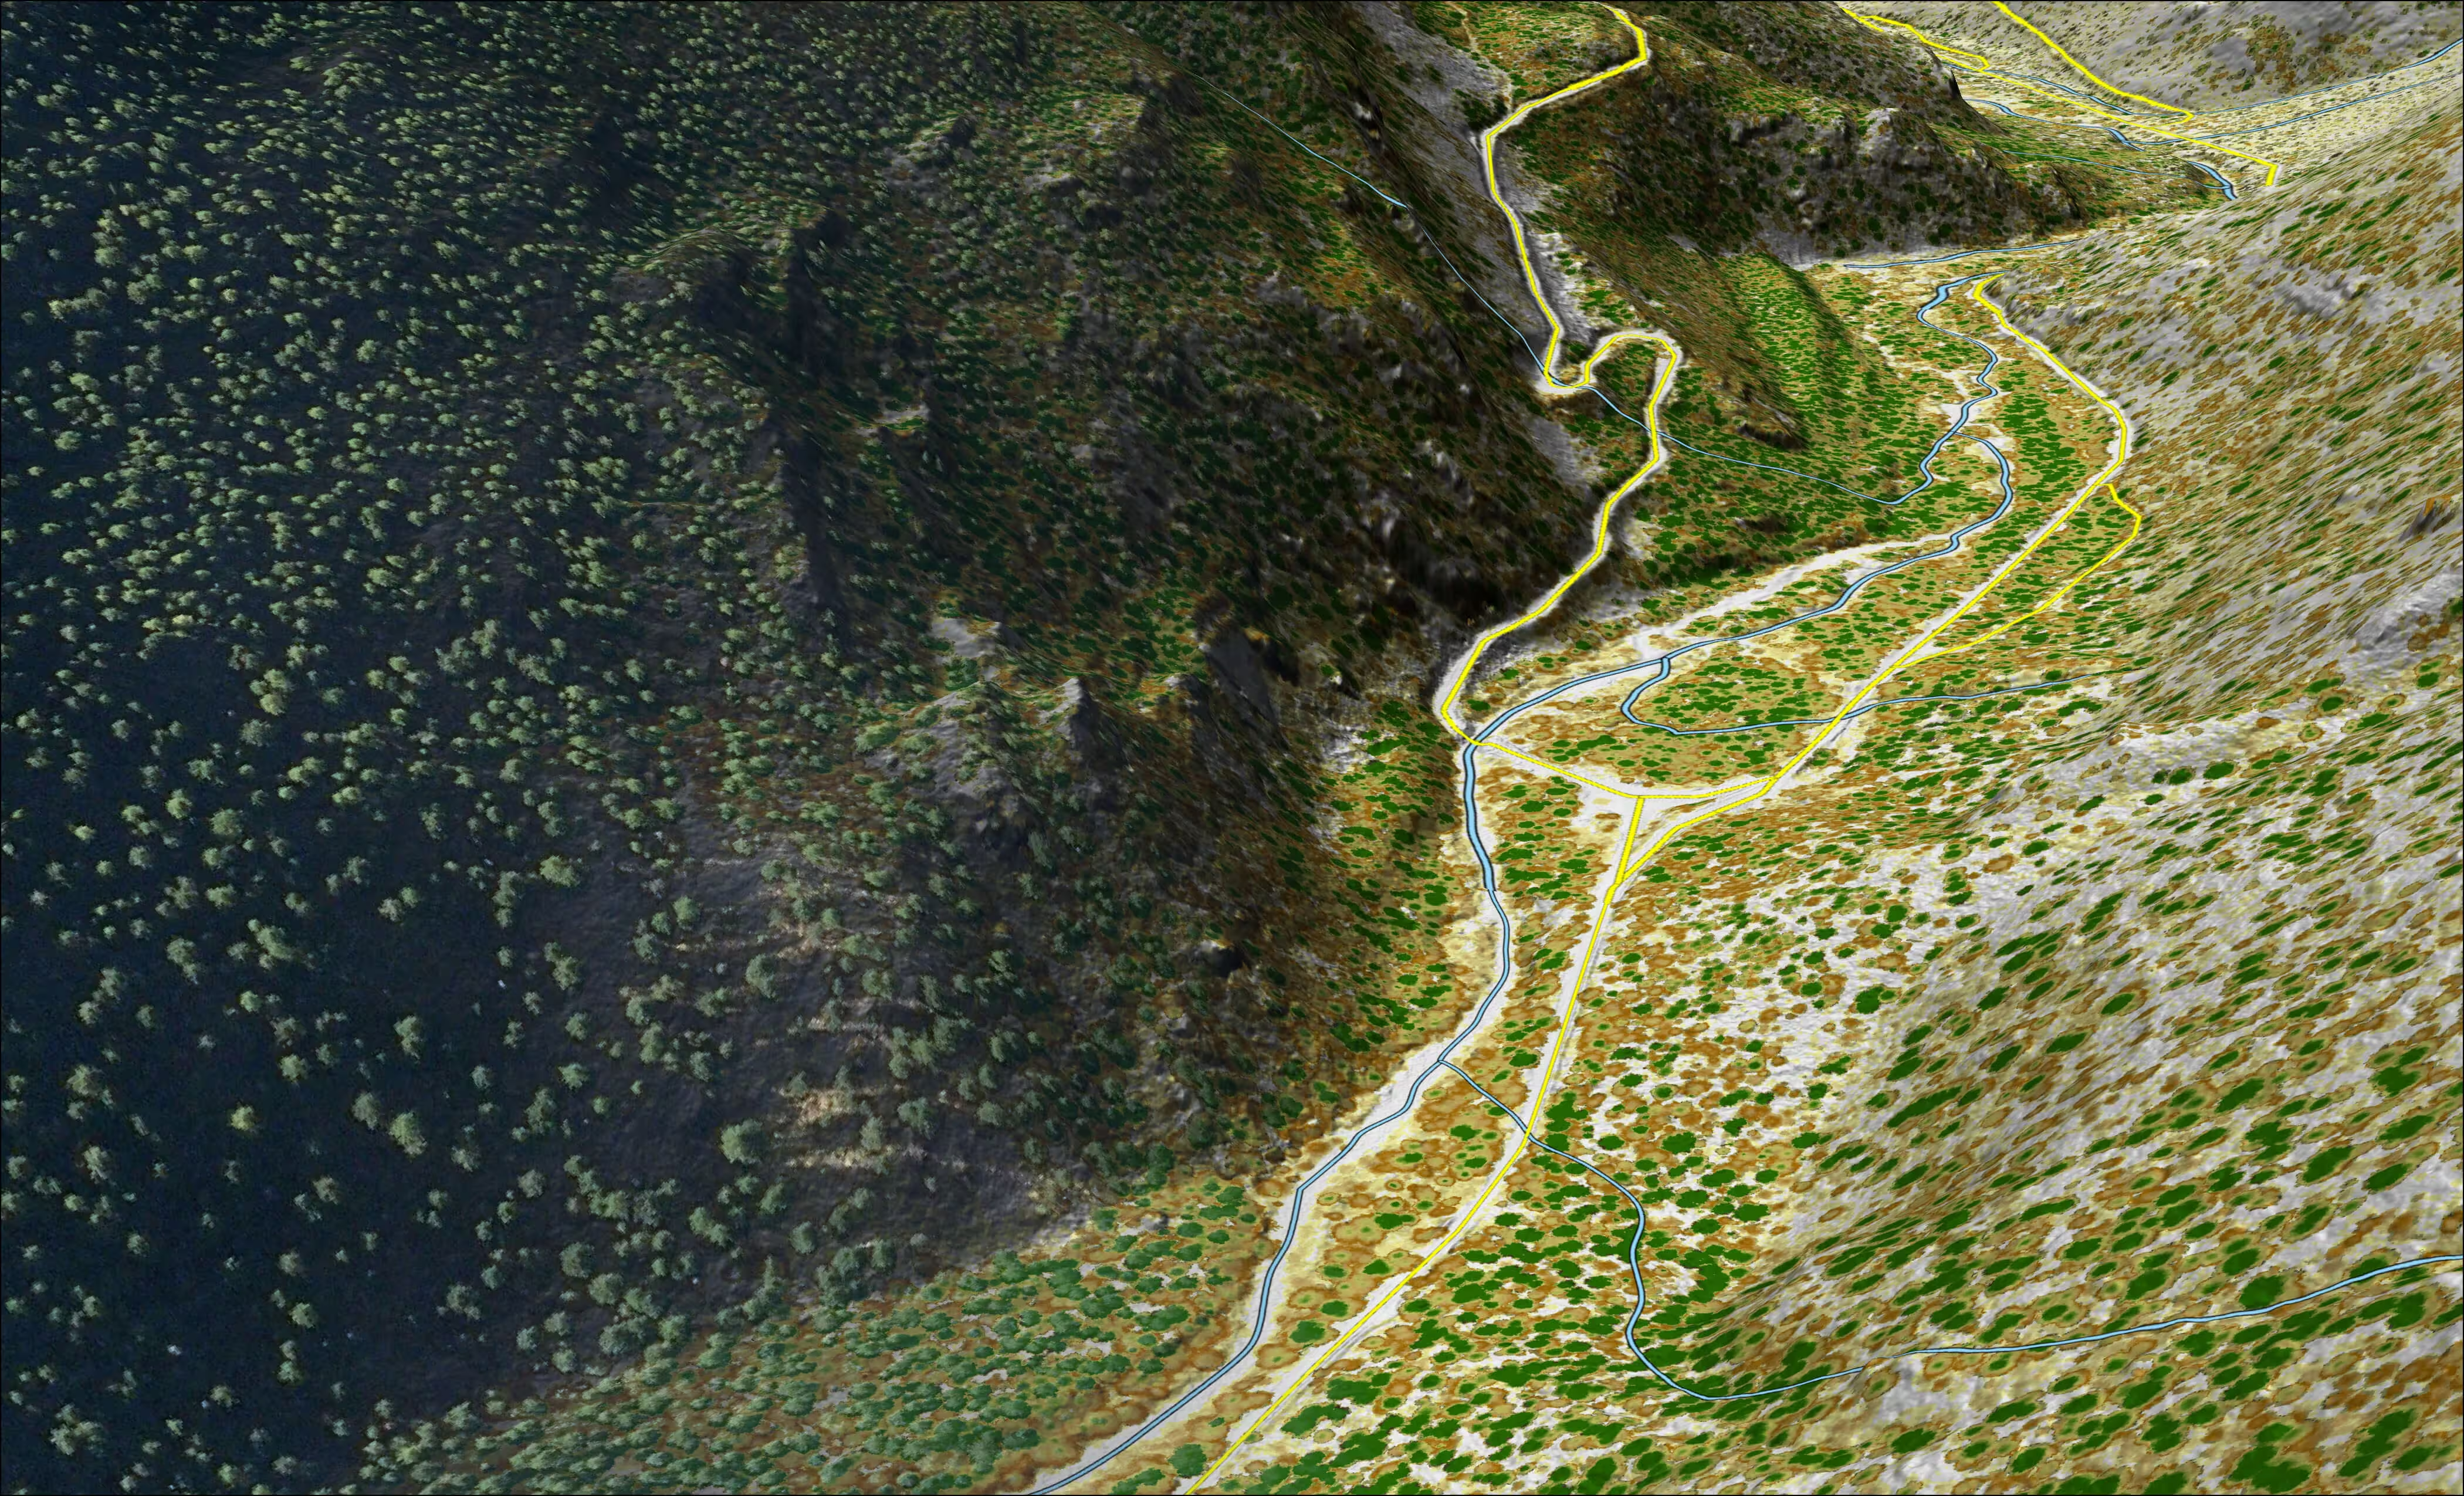
Roads and streams mapped from LiDAR data.
Plan access, road layout, and stream crossings
See where roads cross streams before you plan maintenance or upgrades
Road surface condition and slope, stream gradient, and stream shade are available as upgrades on request
See What You Get
Explore real products. Fly over a landscape and see the layers in action, first the bare ground, then the canopy, then each tree. It's a digital view of the landscape you work in.
Visit the Exchange Storymap
How does it work?
Search. Select. Download.
(Coming soon)
Here's how buying will work when the Exchange store opens. Register your interest and we'll let you know when it's live.
- Step 1: Search your area
Enter an address, property, municipality, county, township, or watershed. - Step 2: See what's available
The map shows which products exist for that area, with a short description of each. - Step 3: Buy and download
Check out through the Exchange store, then download your maps and data files.
Looking for more?
Our forestry, wildland fire, and geospatial teams can bring together more than 100 metrics from our LiDAR and field work to support priority management decisions, environmental planning packages, and new data collection that adds value to the work you already do. Custom work is scoped and priced separately.
This is useful for landowners and managers who need a full Digital Inventory® for operations or management plans, counties and fire districts building an HMP, CWPP or CWRP, and agencies or companies looking for data in an area we haven't flown yet.
Why Our Data is Different
Measured, Not Estimated
Most land data is estimated from a few field plots or from satellite images too coarse to show a single tree, measure its height, or find roads and trails under the canopy. Exchange products are built on measured tree structure and high-resolution terrain. Our aircraft laser-scan every foot of ground, so you see each tree and feature on your land, not an average.
45+
aircraft
1.2
billion acres of LiDAR collected since 2004
Under 12"
vertical accuarcy
Primary use cases
Who Uses Forsite Exchange Data
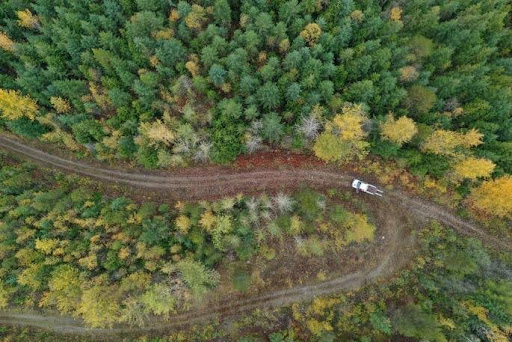
Forest landowners and natural resource professionals
See what's on your land tree by tree, plan roads and harvests, and decide where fire risk needs work first.
Use the digital tree inventory and canopy height model together to see what’s growing where, tree by tree
Value timber and plan harvests without walking every acre
Fire burn severity layer: how severely fire could burn across your area
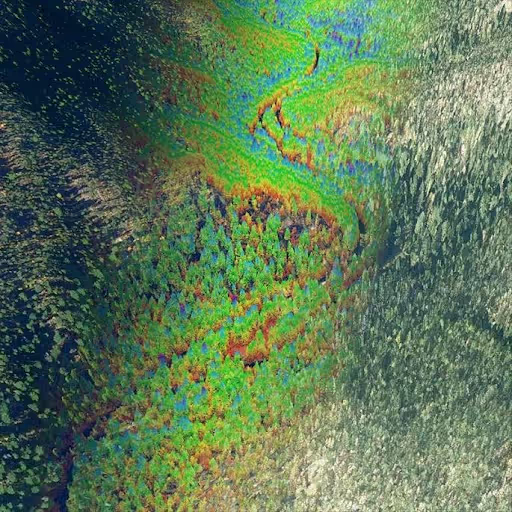
State and federal agencies
Current terrain, forest, and fire fuels data across ownership boundaries.
Individual tree volumes, crowns, and product distributions support precise unit design
Road, stream, and slope layers enhance engineering feasibility and access planning
Fire risk and fuel condition layers inform safer operational timing and layout decisions
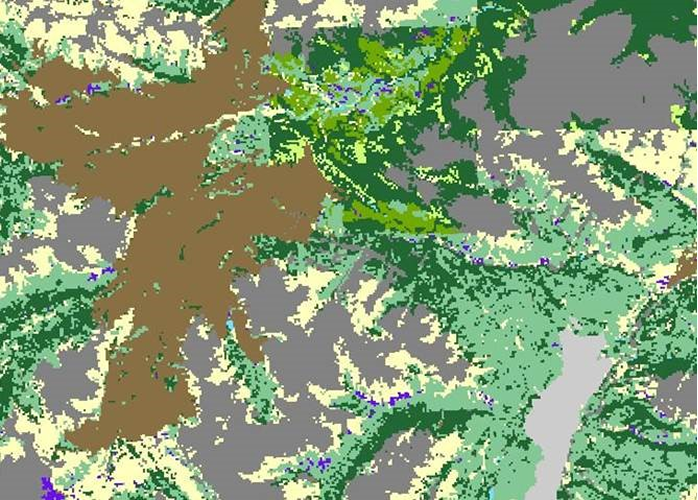
Municipalities, counties, and fire districts
See where wildfire projects may have the greatest mitigation impact. Ask about our geospatial planning packages for HMPs and CWPPs.
Use the digital tree inventory and canopy height model together to see what’s growing where, tree by tree
Value timber and plan harvests without walking every acre
Fire burn severity layer: how severely fire could burn across your area.
Consultants and engineers
Finished elevation, transportation, canopy, and tree data to support the services you provide your clients.
Detailed terrain features, slopes, contours, and elevation changes that may be missed with lower-resolution datasets
Road and stream layers enhance engineering feasibility and access planning
Investors and Insurers
Calculate a starting timber value or estimate wildfire burn severity on landscapes we've already mapped.
Use the digital tree inventory and canopy height model together to see what’s growing where
Value timber and plan harvests without walking every acre
Fire burn severity layer tells you how severely fire could burn across your area
What Exchange Can Tell You About Your Land
What it answers:
Forest land intelligence
Understand the whole forest, not just the trees. The canopy height model shows tree silhouettes across your property, and the Digital Inventory® maps single trees at locations you can walk to. Each tree has a height, diameter, crown area, live or dead tag, and an estimated species label. Together they show the structure wildlife depend on, like dense cover, open meadows, standing dead trees, and the canopy shading your streams. Use them to estimate timber volume, see where wildlife habitat exists, or decide where to thin, harvest, or leave things as they are.
Wildfire intelligence
See which areas of the landscape would burn hardest if a fire came through, acre by acre. Use it to decide where to thin, clear brush, or make space around buildings first.
Terrain
Look beneath the canopy to see the true shape of your ground. Know where it's too steep to work and where water collects before you put equipment on the ground.
Roads & streams
See where roads and streams run and where they cross. Plan access and keep roads and harvest work away from sensitive areas.
Benefits
Nothing to schedule; LiDAR flights depend on weather and season, and many of ours are already done
Start with one layer and add more as your project needs them. Buy once or subscribe, priced by product and acreage.
Built and checked by the same natural resource professionals and analysts behind ForestView® and FireView™
outcomes
Numbers that hold up
We measure every acre and verify our products against field measurements, so you can show a manager, buyer, lender, or agency exactly where your numbers came from.Your land, not an average
Every layer combines a high-density laser scan with field verification. It reflects your actual forest conditions, slopes, roads, and wildfire fuels, not averages for the county or region.Consistent dataset
The same flight measures the ground, the canopy, and the individual trees. Timber, roads, water, wildlife, and wildfire planning all start from one consistent dataset.
Frequently Asked Questions
What is Forsite Exchange™?
An online store for finished landscape intelligence, meaning maps and data products made from aerial surveys we've already flown and processed. The store opens soon.
Do I need GIS experience to use the products?
No. If you've never used GIS, start with the field-ready PDF maps on your phone or tablet. The data files are there when you or a consultant want to go deeper.
Which layer should I start with?
Start with the question you need answered. To understand the ground, start with the elevation model. To see your timber, use the canopy height model and the digital tree inventory. For wildfire planning, pair the burn severity layer with the elevation model.
Can I request a custom analysis?
Yes. Our teams build detailed inventories, management scenarios, fire models, products built to your own standards, and new LiDAR collection. Custom work is priced separately.
Is coverage available everywhere?
Not yet. Exchange launches with Idaho first, about 17 million acres, and we'll add areas as we fly and process them. Don't see your area? Reach out to us to suggest it.
Can Exchange data support a community wildfire or hazard mitigation plan?
Exchange products are a strong start, but they won't cover everything a plan needs. Ask us about our geospatial planning packages, built around the data and maps your plan needs and sized to fit a planning budget.
Can I buy the raw LiDAR data?
Not through Exchange right now. Exchange sells finished products made from the LiDAR. If you need LiDAR data itself, talk to our geospatial team.
What is LiDAR, and why does it matter?
LiDAR is a laser scanner mounted on a plane. As the plane flies, it sends out millions of laser pulses and measures how long each one takes to bounce back from the ground, the trees, and anything built below. The result is a detailed 3D measurement of the land that shows how tall each tree is, how steep each slope is, and where water will run in a storm. Combined with our field work and imagery, it's what lets us measure each tree and slope instead of estimating them. You don't need to understand LiDAR to use the products we make from it.

Find Out What's Available to You
Tell us where you work and what you need. We'll let you know which data products cover your area. Want our data on your landscape? Suggest an area and help us decide where to fly next.